Traceroute
Traceroute is a network diagnostic utility that discovers the network path between two hosts. A traceroute report is vital to identify network issues like routing loops, asymmetric routing, and network congestion. It can also help identify incorrect routing table definitions or firewalls that may be blocking ICMP traffic. For a step-by-step troubleshooting network problems guide, refer to this resource.
For this reason, this command is an essential troubleshooting utility of the Internet Protocol suite. Similarly to ping, traceroute relies on the Internet Control Message Protocol to gather information about the underlying path to a destination server or network.
In traceroute lingo, a hop is a router located between the source computer that executes the command, and the destination point. The first hop usually represents the local network router connected to the source device. The information per node printed in a traceroute report generally includes the IP address, hostname/DNS name, and the round-trip time in milliseconds from the sender. If you need to parse network payload text using command line tools, check out ngrep.

How to Run Traceroute
This tool is available on all modern operating systems. To run traceroute, the user should open the command prompt, or terminal, on their system. The primary difference between different implementations is the name of the command: traceroute on most unix-like systems, and tracert in Windows. To obtain traceroute on Linux, certain package managers like yum or APT can be used to install it. The traceroute6 and tracert6 commands provide similar functionality as traceroute but for IPv6 networks.
In Windows, from the start menu, type “cmd” in the Run box to open the command prompt then type tracert followed by the destination host or IP address and press Enter.
In a Mac or Linux computer, the user opens the terminal and type traceroute, followed by the destination host. After typing the command, the user should press Enter to execute it.
Reading a traceroute report
Here below we report the route tracing results to www.google.com including the round trip times to intermediate hops:
1 my.meraki.net (10.1.36.1) 10.140 ms 2.565 ms 3.272 ms
2 164.52.244.85 (164.52.244.85) 5.580 ms 4.006 ms 3.104 ms
3 64.58.254.226 (64.58.254.226) 4.069 ms 2.501 ms 5.308 ms
4 * * *
5 * * *
6 g-l3-60g.washingtondc.level3.net (4.68.71.186) 85.500 ms 9.336 ms 8.873 ms
7 108.170.246.1 (108.170.246.1) 10.156 ms 10.853 ms 13.887 ms
8 216.239.54.205 (216.239.54.205) 8.865 ms 9.400 ms 9.387 ms
9 iad30s08-in-f132.1e100.net (172.217.7.132) 9.145 ms 9.527 ms 12.434 ms
For each result, the traceroute output includes:
- the hop number,
- the fully qualified domain name if available,
- the router’s IP address in parenthesis, and
- three RTT measurements expressed in milliseconds. Traceroute sends three packets to each hop by default and displays the round-trip time for each one of them. The traceroute output lists each hop along the path as well as the round-trip time in milliseconds for each hop.
By default, probes are sent using ICMP packets on Windows and UDP on Linux and Mac OS X. On Unix-like systems, traceroute sends a sequence of User Datagram Protocol (UDP) packets by default. Either operating system also has the option to change the transport protocols.
Advanced options include reporting each hop’s Autonomous System, adjusting the probe packet’s Maximum Transmission Unit (MTU), and more. You can inspect your operating system’s documentation for more command options. In Linux, type “man traceroute” in the command line prompt, while in Windows type “tracert /?” on the cmd prompt.
By default, both traceroute and tracert send three packets for each hop. As a result, traceroute probes could discover more than one path. It will also return three RTT measurements for a specific hop.
How does traceroute work?
Let’s see how traceroute works. To discover the network topology, the traceroute tool uses the Internet Control Message Protocol (ICMP) Time Exceeded message. A host returns this Internet Protocol message to the sender when it receives an IP packet with Time To Live (TTL) set to 1.
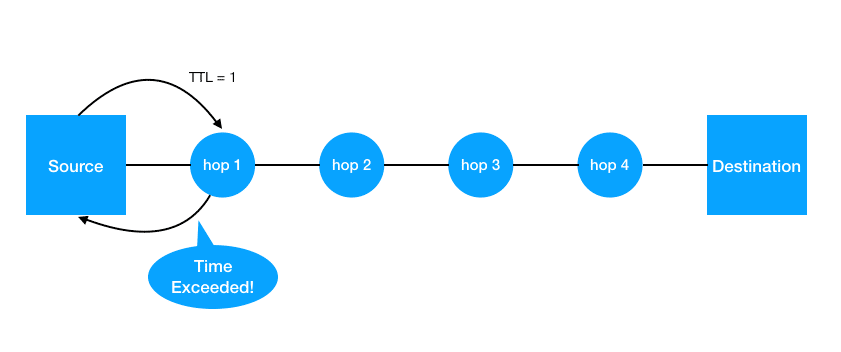
When that happens, the router discards the packet, and sends an ICMP Time Exceeded message to the source IP address as response. This notifies the source that the router discarded the packet.
This mechanism helps IP networks avoiding routing loops. Routing loops occur when routers forward packets endlessly. In its current implementation, the maximum TTL value in IPv4 packets is 255.
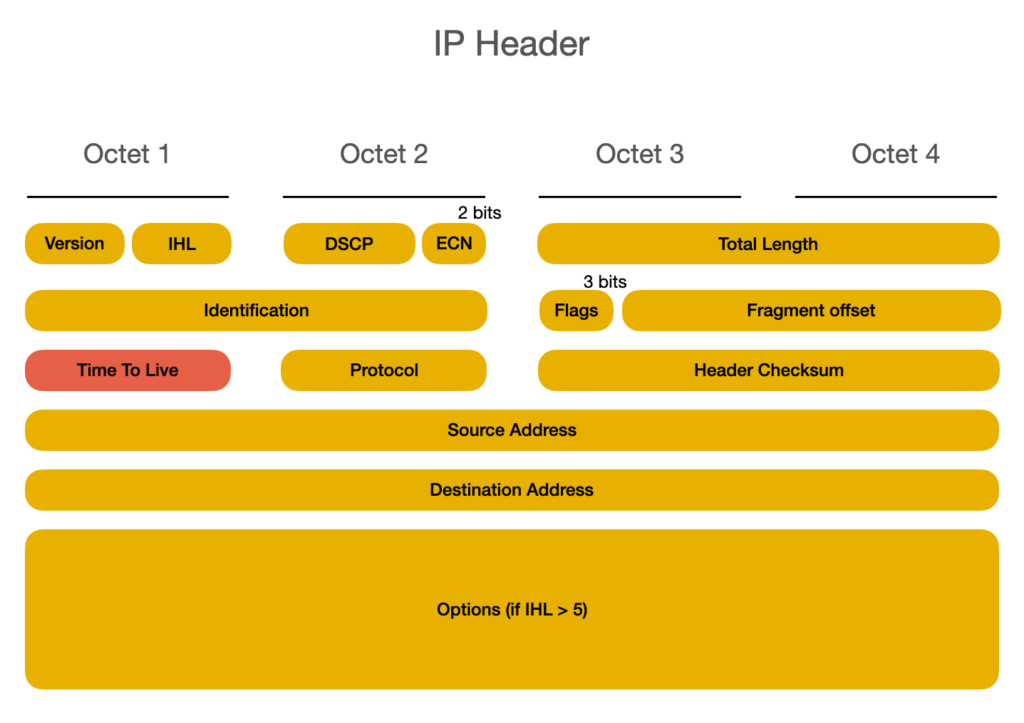
TTL works the following way: when a router or host receives a packet, it decrements the TTL value by one. When a router receives a packet with TTL equal to 1, its time has exceeded. The router or host will discard the packet and send as response an ICMP error message Time Exceeded (Code 11) to the source. This mechanism prevents routing loops, which can cause issues similar to broadcast storms, common in layer two switching.
Example of a Time Exceeded packet notification as captured with tcpdump:
IP my.meraki.net > 10.1.36.5: ICMP time exceeded in-transit, length 60Example of a traceroute run
Let’s see what happens when you run a traceroute or tracert command. To discover the first hop, traceroute sends a UDP packet with a TTL equal to one. The first router to receive the packet inspects the TTL, reduces by one, and sends a Time Exceeded back to the source.
To discover the second router, the utility sends a new UDP packet with the TTL value set to 2, and so on. Hop by hop, the command builds the list of routing hops to destination, including the round trip time to them.
The command terminates when it either reaches the destination host, or it reaches the maximum number of hops set. By default, most implementations set the maximum number to 30 hops. The user can change this value via the command line.
Traceroute Limits
Traceroute has limitations that can affect its ability to accurately map the network infrastructure. Network engineers should be aware of two main limitations when using this command: unresponsive hops and redundant links. If a traceroute shows several timeouts in a row, it can indicate a problem with a router or gateway after the last successful hop.
Unresponsive hops: the notorious asterisk (*)
When a router doesn’t send a response, an asterisk will appear instead of its IP address. If a hop does not respond within the time-to live value, an asterisk () is displayed in the traceroute output. If a hop does not respond within the time-to-live (TTL) value, an asterisk () is displayed in the traceroute output. As an example of this behavior, you can review hops number 4 and 5 of the example shown above. This can happen for different reasons …
The most common reason for an unresponsive hops are firewalls. Network administrators may block either the traceroute probe packets from the source or the response ICMP Time Exceeded packets.
If a firewall blocks the probe packets, the user can change the destination UDP port or try different transport protocols (ICMP, TCP, or UDP). Certain firewalls may block all traffic, leaving limited options in such cases.
Another reason is virtual routers or other network devices that don’t process or support ICMP packets. In this case, there’s very little that can be done to avoid that notorious asterisk.
Load balancing and traceroute
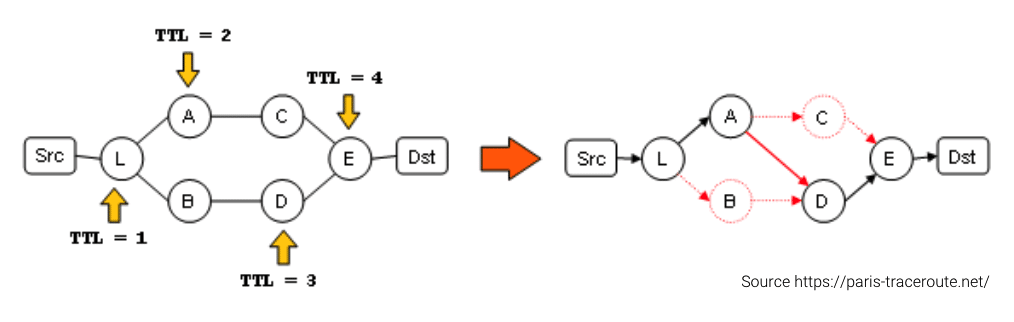
Another limit of traceroute relates to networks that implement load balancing, or Equal-Cost Multi-Path (ECMP) routing, to increase bandwidth and redundancy. When traceroute sends traffic across such a redundant network, the response packets could take different return routes. As a result, a traceroute report may represent an incorrect underlying topology. Plotting traceroute results on a map is difficult due to the challenge of obtaining accurate IP address geolocation data. The following image well depicts the issue.
If you work for an internet service provider or a medium to large enterprise organization that implements ECMP, you will need a better way to troubleshoot performance issues.
Paris traceroute tool
To overcome the ECMP limit, this traceroute technique crafts UDP packets so that the response ICMP Time Exceeded messages appear to belong to the same flow. By doing so, the intermediate hops will select the same interface when forwarding the ICMP return traffic. This technique helps avoiding the issue described. This is done by manipulating the UDP checksum of the traceroute probe packets crafted. If you want to learn more about it, check out the project’s page: https://paris-traceroute.net/.
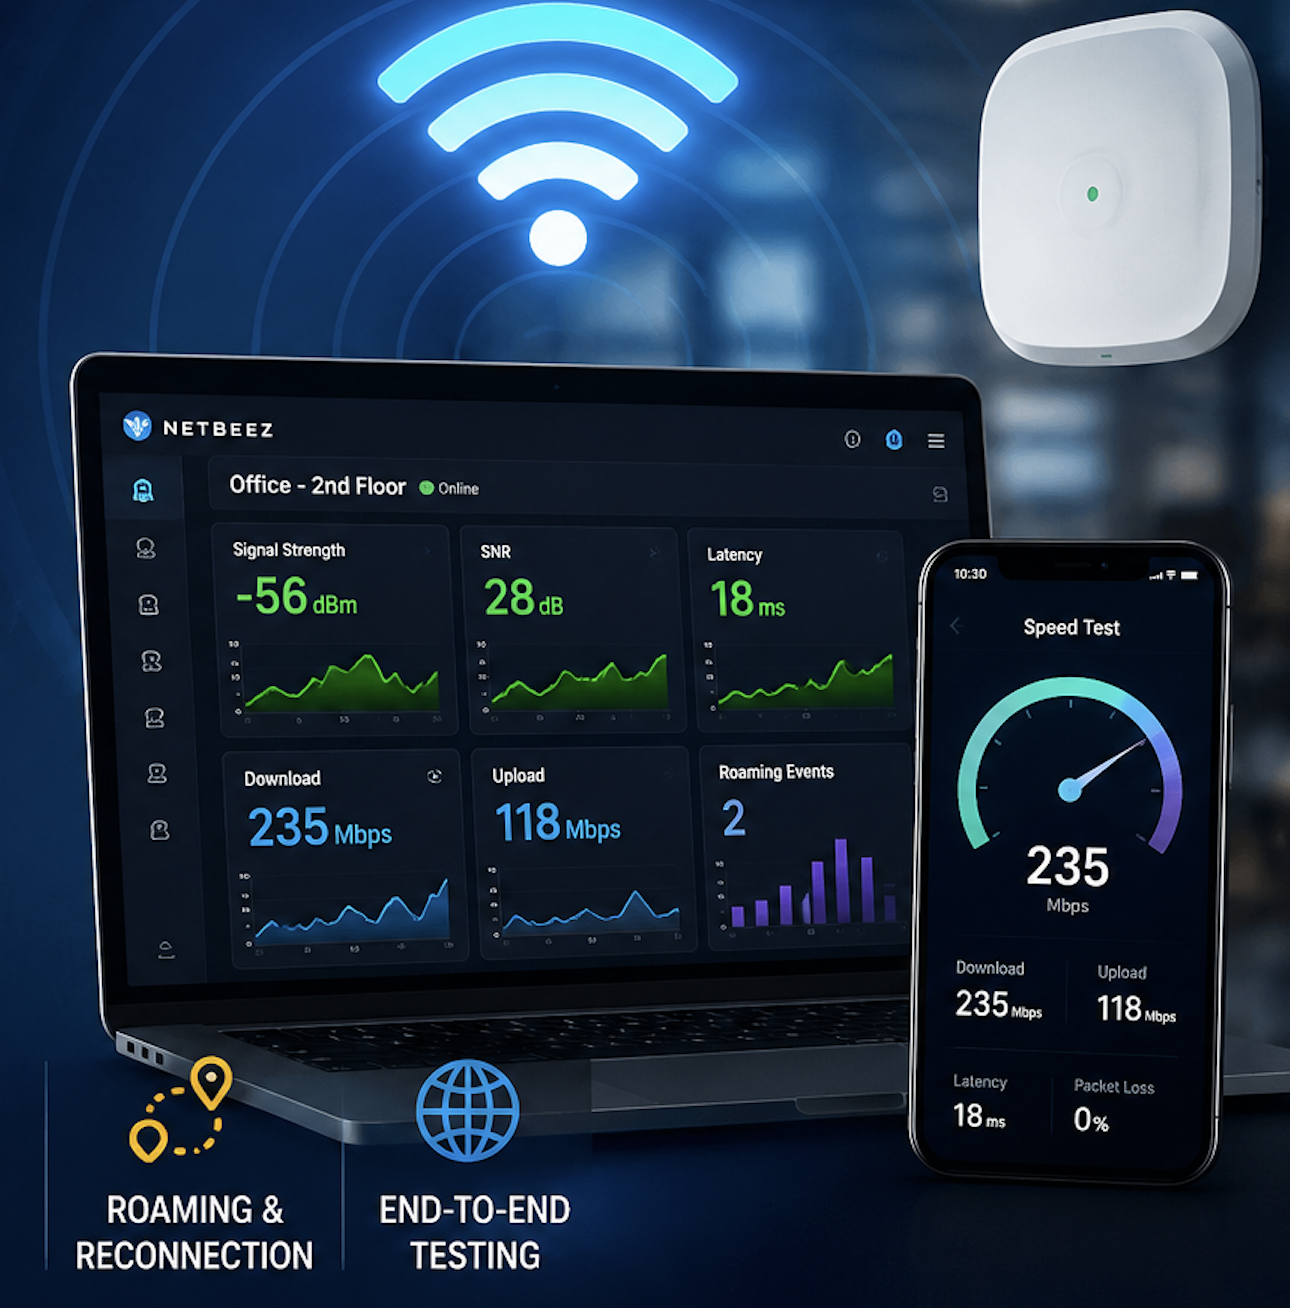
Using Traceroute in NetBeez
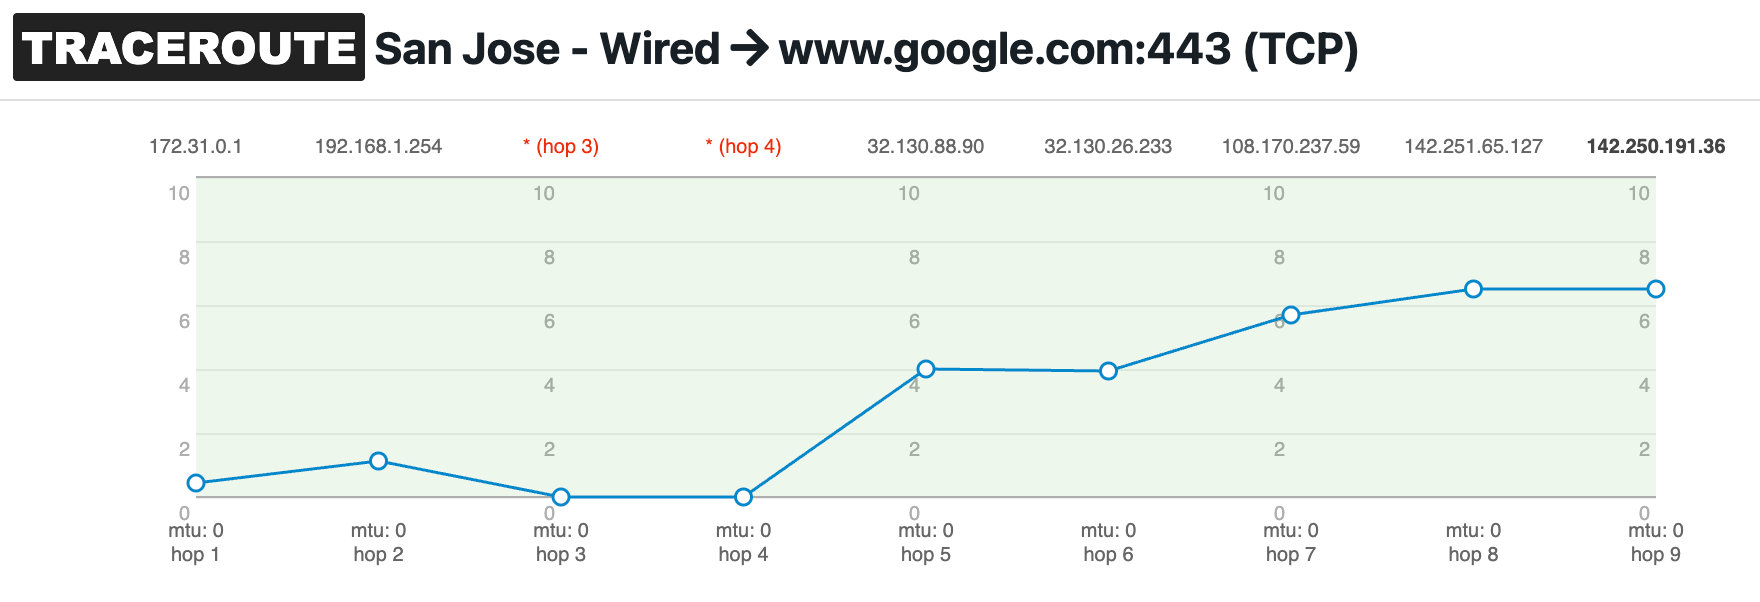
NetBeez is a synthetic network monitoring solution that enables network administrators to run tests at scale from multiple locations. The system supports the traceroute tool to discover the hop count between a source agent and a destination hot. The dashboard lets the user select common options, including the preferred transport protocol. This multi-protocol support helps bypass firewall rules and network settings that may block specific types of traffic. The output data includes network latency, IP, FQDN, and MTU per hop. The traceroute online test will show response times for each responding hop in the path.
Here’s a quick screenshot of a traceroute output in NetBeez:
NetBeez and path analysis
NetBeez includes the option to monitor a network topology via dublin traceroute, a tool with very similar characteristics to paris traceroute. We call this variant of the traceroute tool path analysis. Path analysis is a great aid to identify where performance issues originate, whether on the ISP’s network, or on the
Conclusion on traceroute
Traceroute remains a fundamental network testing tool for network engineers. With it, IT professionals diagnose connection issues more effectively and optimize network performance. This tool is invaluable for troubleshooting latency, packet loss, and routing problems. High latency can significantly impact the user experience in real-time applications like VoIP and video conferencing. As networks become more complex, redundant, and virtualized, traceroute variants like path analysis help maintain visibility and ensure reliable performance across distributed environments.