In this article, we’ll analyze how network performance impacts the end-user experience. We will explain how two network metrics like round-trip time and packet loss impact a web application’s response time. This analysis will not cover other factors related to an application back-end, like a web server or database performance. The reason being that they are outside a network engineer’s control.
End-User Experience of Web Applications
The Stanford Linear Accelerator Center did a study on network performance and HTTP response time. The study reported a clear (2x) correlation between round trip time and HTTP response time. In the following figure you can see that, for each data point, the lower bound of an HTTP GET is twice its round trip time.
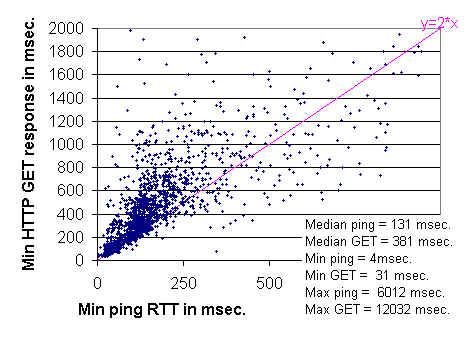
Figure 1 – Correlation between HTTP GET response time and ping RTT (source http://www.slac.stanford.edu/comp/net/wan-mon/tutorial.html).
The reason is that a minimal TCP transaction involves two round trips. The first one to establish the connection between the client and the server. The second to send the HTTP GET request and receive the response.
Let’s now see what impacts round-trip time.
Round-Trip Time
Round-trip time represents the time that it takes for a data packet to go back and forth to a specific destination. There are two main factors that impact the round-trip time:
- The distance between the two hosts where network latency is the time that it takes for a packet to travel across one link.
- The delay at each intermediate hop, that is the amount of time that a node spends when processing (e.g. routing) a packet.
In this table you can see different values of RTT based on the coverage of a network. For instance, the round-trip time of a Local Area Network is between 1 to 5 milliseconds. A metropolitan area network is between 3 and 10 milliseconds, and so on …
| Link Type | RTT Range |
|---|---|
| Local Area Network | 1 – 5 ms |
| Metropolitan Area Network | 3 – 10 ms |
| Regional | 10 – 20 ms |
| Continental | 70 – 80 ms |
| International | 100+ ms |
Packet Loss
Packet loss is a good measure for link quality. Packet loss is the percentage of packets that are received malformed or not received at all at the destination. A malformed packet somehow along the path it was not correctly transmitted. To detect malformed packets, the TCP receiver computes and then compares the packet’s checksum with the one sent by the source.
So how does packet loss affect the end-user experience?
The TCP congestion control and avoidance rules the throughput that a source and a destination host can achieve. When a TCP connection detects packet loss, it reduces the throughput to match the speed that the network can sustain. As a result, packet loss slows down TCP connections.
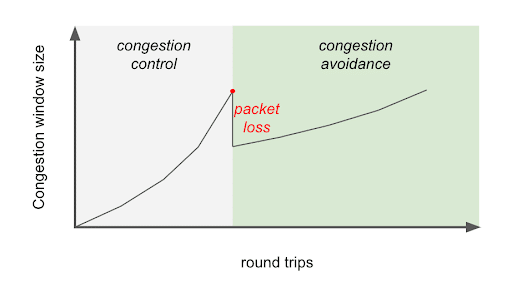
Figure 2 – Correlation between TCP congestion window size and round trips.
Throughput
Throughput is the amount of data successfully transferred between a source and a destination. This parameter should not be confused with bandwidth or data rate. Bandwidth, like data rate, is the maximum throughput achievable on a network or link. It is generally established by the the media and encoding technologies. Throughput is the actual transfer rate achieved between two hosts.
TCP is the protocol used to browse web pages and download files. It’s very important to familiarize with the network metrics that have an impact web browsing and download speeds. Three core parameters affect TCP throughput: MSS, which is a Maximum Segment Size, Round-Trip Time, and packet loss.
Bandwidth Delay Product
Bandwidth delay product is an important parameter of a TCP connection. TCP (Transmission Control Protocol) is a connection–oriented protocol: Every packet transmitted will be acknowledged by the receiver. Unlike UDP, which doesn’t require acknowledgement, TCP will ensure that all packets are successfully received by the destination host.
In TCP, if the source fails to receive an acknowledgment within a certain time window, it will repeatedly retransmit the packet until the receiver successfully receives and acknowledges it.
The amount of data sent by the source on the circuit (but not yet acknowledged) is called Bandwidth Delay Product. This value can be easily calculated by multiplying the data rate of a link by its round-trip time.
Throughput as a function of latency and packet loss
The chart below reports the impact of packet loss and round trip time on TCP throughput. The ESnet team created this chart when they were troubleshooting a dirty optic on one of their routers. The optic was causing 0.0046% of packet loss. That corresponds to one packet to every 220,000 packets: A very small number! Even with such a small error rate, the throughput quickly decreases as the round trip time value increases.
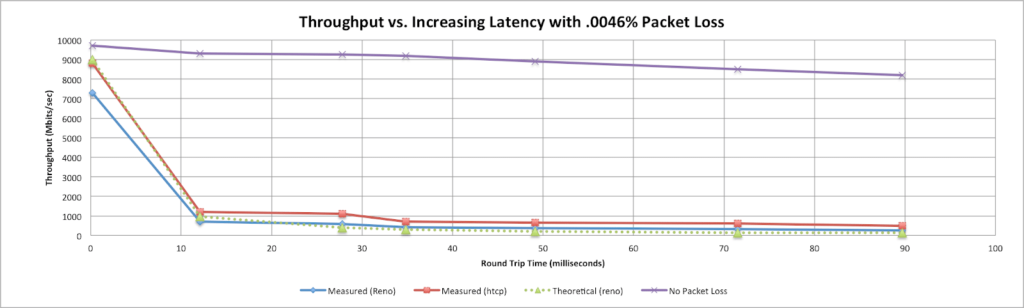
Figure 3 – Impact of latency and packet loss on TCP throughput (source http://fasterdata.es.net/network-tuning/tcp-issues-explained/packet-loss/).
Conclusion
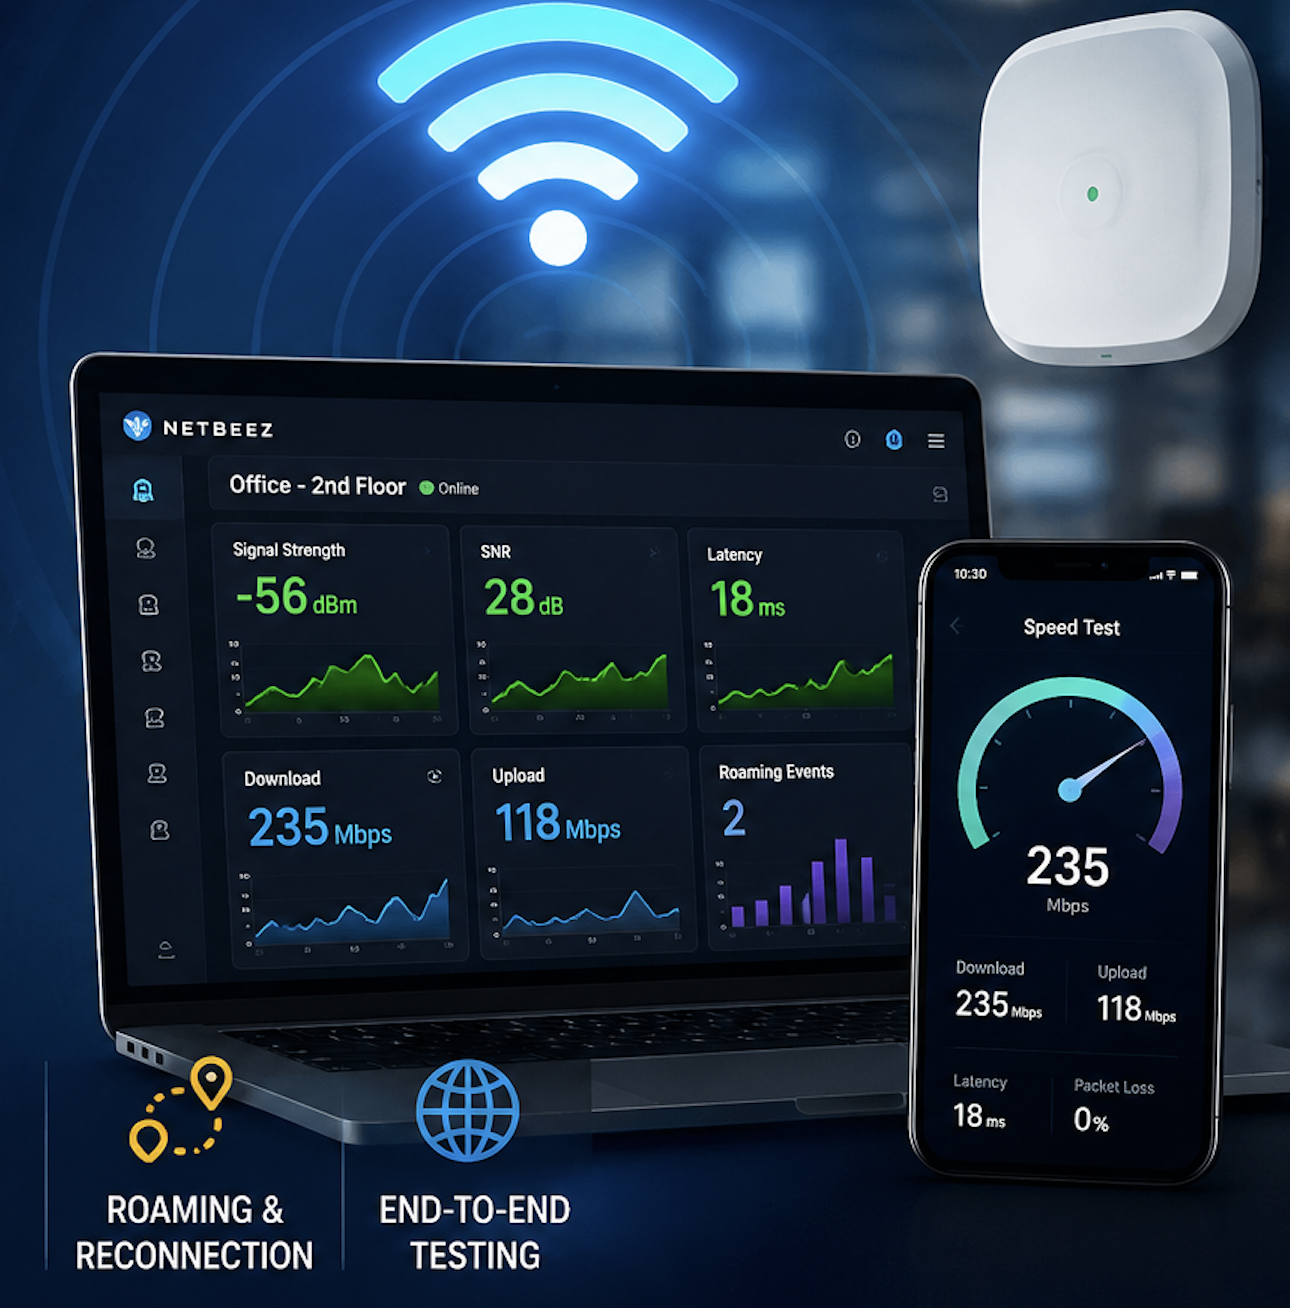
It’s important to know and monitor key performance metrics for network performance. NetBeez is a network performance monitoring solution that provides an easy way to proactively detect performance degradation issues. The platform monitors packet loss, latency, and throughput, sending alerts when issues arise. Request a demo to learn more.