Network monitoring helps network managers check the status and performance of a digital system. A server regularly checks the status and performance of network devices, and alerts if there are problems with them.
The landscape of network monitoring tools is vast, as it offers a multitude of options to choose from. As a result, it’s important to understand what data each class of tools provides. In this post, we provide guidance to help you identify the best network monitoring solutions for your enterprise network. We’ll go over the following sections:
- Benefits of network monitoring
- Types of network monitoring tools
- Differences between tools
- NetBeez network monitoring
Network Monitoring Benefits
Network monitoring tools are of vital importance as they empower organizations and IT teams to:
- Proactively Detect Issues: Network monitoring tools connect to network devices to identify anomalies or performance degradation issues. They help identify an issue with a network component as soon as it happens. The proactive approach of network monitoring save organizations several hours of downtime and costly repairs.
- Optimize Network Management: Network monitoring tools highlight critical performance metrics that help tune the network configuration. Metrics like bandwidth available, usage, and traffic patterns allow network administrators to make informed decisions for capacity planning.
- Secure the Network: Security breaches and threats are more common. Organizations must get ready by finding and reducing these risks. Network monitoring tools solve a critical function of security monitoring.
- Save Costs: Network monitoring helps Network Operations to implement optimizations, proper planning, and reducing troubleshooting costs. Help Desk teams can save money on support hours. They can do this by allowing technicians to collect all the data needed. This helps them quickly handle customer complaints or requests.
Types of Network Monitoring Tools
There are three main categories of network monitoring tools:
- SNMP which is the primary protocol used by most organizations to implement network device monitoring on their network infrastructure.
- Passive tools monitor clients and protocols’ bandwidth usage. It also has deep packet inspection features for network security monitoring.
- Active monitoring tools implement continuous testing and synthetic transactions to capture the end-user experience and quality of service of a digital infrastructure.
Each one of them has a specific function, with associated benefits and limits. In the following sections, we will review each one of these tools.
SNMP Monitoring Tools
The majority of network monitoring systems today use the SNMP protocol to monitor network devices (e.g. switches and routers). A server and a set of one or more agents compose the SNMP architecture. The servers, called SNMP pollers, check the status of SNMP enabled devices.
They monitor resource use, like CPU usage, memory use, and data sent and received on their interfaces. SNMP tools generate alerts when network components become not accessible or experience resource overload.
The following picture shows how SNMP works. An SNMP poller, or server, regularly asks an SNMP agent (the monitored device) for its status and available resources.
In this specific example the poller is requesting the SNMP agent the local machine’s hostname. The SNMP agent returns the hostname as a string. This is how SNMP-based servers monitor network elements.
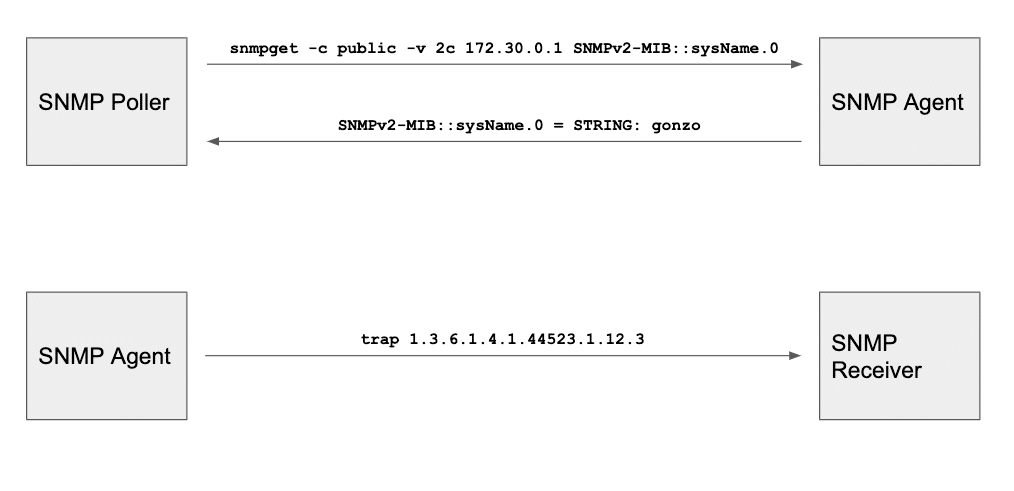
On the bottom of the above chart, we see a different functionality of SNMP. This time an SNMP agent agent sends an SNMP trap to an SNMP receiver (server) to alert about a failure. This type of transaction allows network components to report problems to an SNMP server. This way, the server can alert the network administrator.
Passive Network Monitoring Tools
Passive network monitoring systems process and capture real user data (also called traffic flow). These tools generate aggregate traffic monitoring statistics, breaking them down based by protocols and hosts.
The network administrator can identify the machines (top talkers) that are consuming the capacity of a specific network. Passive tools can check a specific sequence of packets. This helps find performance issues between a client and a server.
Passive Monitoring Components
Three ways to passively monitor a network include network TAP, SPAN port, and flow-based protocols. Let’s briefly introduce each one of them:
- Network TAPs are dedicated devices that reside “in-line” a network segment so they analyze traffic flowing across it. A network TAP replicates the entire content of the frames (layer 2) flowing across. For this reason, network TAPs are the best option for Deep Packet Inspection (DPI). Many SIEM (Security Information and Event Management) tools adopt this technology to proactively identify and mitigate potential security breaches or attacks.
- Network administrators set up SPAN (Switch Port for ANalysis) ports on a switch to generate a copy of traffic from a specific port or VLAN. This copy goes to another port on the same switch or to another switch. Someone connected the other switch to a network collector. SPAN ports are able to copy the entire packet, including its payload.
- Flow analysis uses different network monitoring protocols. These can be proprietary, like NetFlow (Cisco), or open, like IPFIX (IP Flow Information Export). Flow protocols don’t capture the full content of a packet, but only the header. This strategy helps collecting traffic statistics.
Active Network Monitoring Tools
Active network monitoring tools send real packets into the network. They measure end-to-end reachability, round-trip time, packet loss, bandwidth, link use, and other network metrics. This type of network performance monitoring tests applications from the user’s point of view. Network administrators also use it for remote monitoring and checking availability.
A monitoring agent executes real transactions against an application, and then measures performance like execution and response time. This technique lets you test the final result of networks and applications. Network administrators don’t need to verify every component to ensure it is functioning properly. The feedback and detection of network outages and performance degradation issues is much faster and more reliable.
Network Monitoring Tools Types: Quick Comparison
| Type | Primary Use | Limits |
|---|---|---|
| SNMP | Network device monitoring as it report the status and performance of network devices, such as routers and firewalls. | Doesn’t capture the end-user experience, but only the status and performance of network devices. |
| Passive | Capture traffic to identify network activity, apps performance, and security incidents. | Reactive network performance monitoring as it relies on real network traffic. |
| Active | Availability monitoring with continuous synthetic tests to measure end-to-end performance and proactive alert of network issues. | Requires installation of a dedicated hardware or software monitoring agent. |
Evaluating Network Monitoring Tools
In general, when evaluating network monitoring tools, it’s important to list key requirements to compare different options. The comparison matrix will help determine which tool scores higher. Below we share some common requirements.
Real-Time
The monitoring interval and data latency of network metrics are key factors in implementing real-time network monitoring. Consider how recent is the network monitoring data displayed on the dashboard. Does it take 5 seconds or 5 minutes for the dashboard to get the latest results?
Notifications and Integrations
What type of notifications does the tool support? What type of third-party applications does it integrate with, such as MS Teams, ServiceNow, etc.
Data Retention
The data retention will help determine the length of the historical data. What’s the storage requirement if hosted on-premises?
Scalability
How well does the tool scale? Does it meet your organization’s scale? How complex is the configuration to achieve that level?
Platform
Does the platform support my organization environment? Is it cloud only, or can it be hosted on-premises?
License and price
Consider if you prefer to opt for a commercial or an open source network monitoring tool, as each option has pros and cons. Consider not only the price, but also the cost to manage it and keep it updated.
Ease of use
How easy is it to use? Do I need specialized skills, or is it pretty self explanatory?
Active vs. Passive Tools
When thinking about Network Performance Management (NPM), what strategy should you prioritize? Should you go with an active network monitoring software, or a passive tool?
The answer it depends form what the user wants to achieve. Most probably, an organization will need both systems to monitor their network, applications, and user experience. Let’s summarize what each one does.
Active monitoring takes an assertive approach by deploying hardware or software agents to run continuous network testing. The agents continuously assess performance. They detect potential issues early, like checking your car’s tire pressure regularly without waiting for the warning light.
In contrast, passive monitoring tools observe and analyze network traffic flowing by. This is similar to spotting problems as they occur, like watching the speedometer for sudden spikes.
The choice between these approaches depends on your needs. Active monitoring helps pinpoint issues and ensures SLAs. Passive monitoring reveals trends and identifies security threats. Ultimately, a combination of active and passive monitoring provides the most comprehensive understanding, ensuring a healthy network and satisfied users.
Cloud vs. On-Premises Tools
Another differentiation for network monitoring tools is whether they run on the cloud, on-premises, or hybrid.
On-premises network monitoring tools run within an organization’s infrastructure. They provide direct control over user access and data retention and residency. This traditional approach offers a higher level of customization and security but requires more maintenance.
On the other hand, cloud network monitoring tools run off-site, where third-party providers manage them. This allows seamless scalability and access from anywhere with an internet connection. Generally cloud-based solutions often come with subscription models. This reduces upfront costs and makes them suitable for businesses with ever growing needs.
The choice between these options depends on many factors, including security, budget, and flexibility.
Network Monitoring with NetBeez
NetBeez is a network monitoring tool. It helps operations and support teams fix performance issues quickly. They can see problems from the user’s point of view. NetBeez monitoring capabilities enable it to monitor:
- Websites, including SaaS, and hosted applications
- VoIP and video (CCaaS, UCaaS) performance
- WAN, SD-WAN, WLAN, and cloud environments
- Internet path analysis to discover the network topology
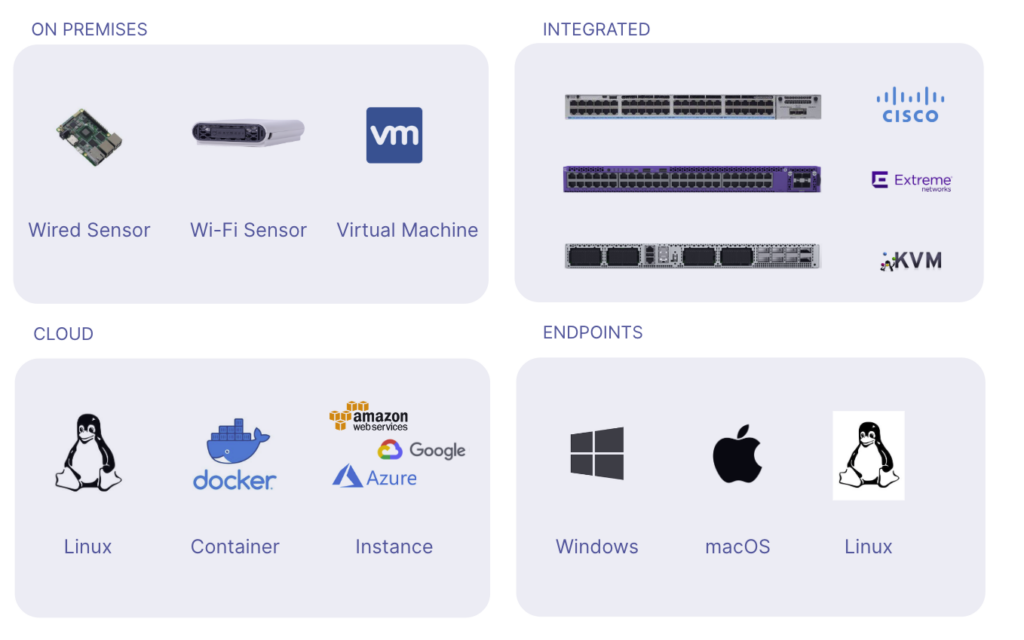
The solution relies on distributed network monitoring agents that provide end-to-end network and application performance metrics. NetBeez agents divide in two categories:
- Network Agents – Virtual, software, and hardware appliances that are installed on on-prem, on virtual environments, and cloud networks. The network agents are hardware probes for LAN and WLAN monitoring, as well as virtual and docker appliances.
- Remote Worker agents – Software clients for Windows, Mac, and Linux operating systems. They provide all the data necessary to monitor the digital experience of Work-From-Home employees.
NetBeez has three key pillars that make it a good solution for network troubleshooting.
Granular Performance Data
NetBeez captures granular network performance metrics to applications and services.
- The monitoring interval can be as low as one second, required to implement an effective network monitoring
- Help isolate with accuracy the exact time and moment when a problem occurs
- Retains historical data to generate baselines, identify trends and recurring issues to perform root cause analysis
Proactive Incident Detection
NetBeez agents run real-time tests, end-to-end, and from the user perspective.
- Continuous active monitoring against networks and applications
- Quick detection and alerting on service failures and performance degradation
- Enforce and guarantee quality of service and SLAs
- Verify and validate configuration changes during maintenance windows
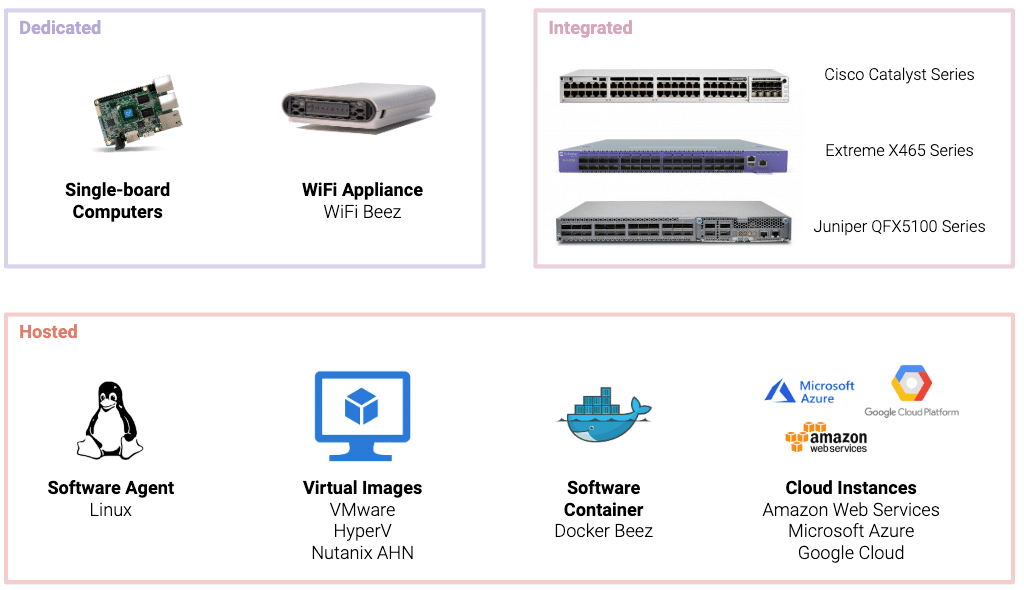
Multi-Platform Deployment
The solution supports flexible deployment options for on-prem, cloud, and remote.
- Deploy the server on-premises as a virtual appliance or in the cloud as an instance
- Support Ethernet and Wi-Fi appliances, virtual machines, Docker, and Linux based agents
- Support Windows and Mac clients
- Easily orchestrate and deploy at scale
Request a free trial now.
How to Deploy NetBeez Network Monitoring
NetBeez provides a simple and effective way to monitor networks from the end-user perspective. NetBeez is an active network monitoring solution. It offers easy-to-deploy network agents and software clients for organizations with a distributed workforce. If you want to learn more about NetBeez monitoring capabilities, request a demo or start a free trial.
Step 1: Deploy network agents in private and public networks
The Network Agents are hardware (Wi-Fi or Ethernet), virtual, or docker appliances. They continuously monitor network availability and performance.
We recommend the installation of one or more appliances at each network location. A network location can be a branch office, a data center, or the headquarters. This way, NetBeez will ensure constant monitoring of network services and applications across your private and public network.
For organizations that need to monitor performance of cloud-based networks or applications, using cloud agents is essential. To have a comprehensive status of SaaS and cloud resources, we recommend to deploy three or more cloud agents . The agents verify availability and performance from public clouds like AWS, Azure, and Google. They will also collect information about outages occurring over the Internet.
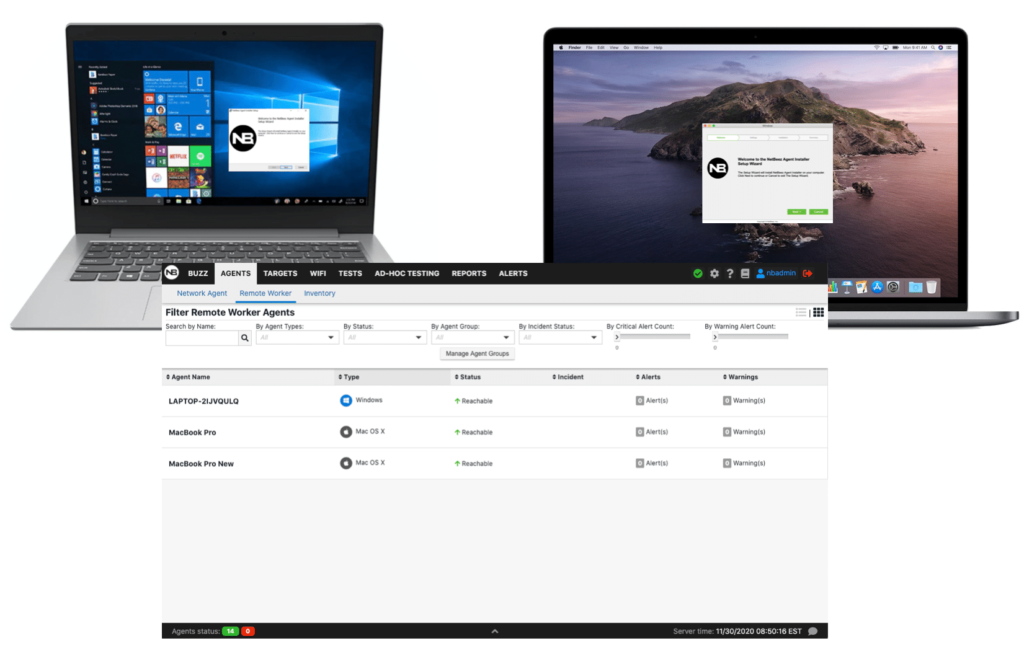
Step 2: Install remote worker agents for end-users
The Remote Workers Agents monitor and test a network availability and application performance from end-user perspective. These lightweight software clients are compatible with operating systems such as Windows, Mac OS, or iGel.
These agents monitor the connection of the user’s wired and wireless network, internet speed, and endpoint performance. They are effective for quickly pinpointing the root cause of network or application issues encountered by remote users.
Step 3: Configure network monitoring targets and scheduled tests
Once the agents show up on the NetBeez dashboard, you can start monitoring the network and applications. NetBeez offers two complementary methods for network and application monitoring: targets and scheduled tests.
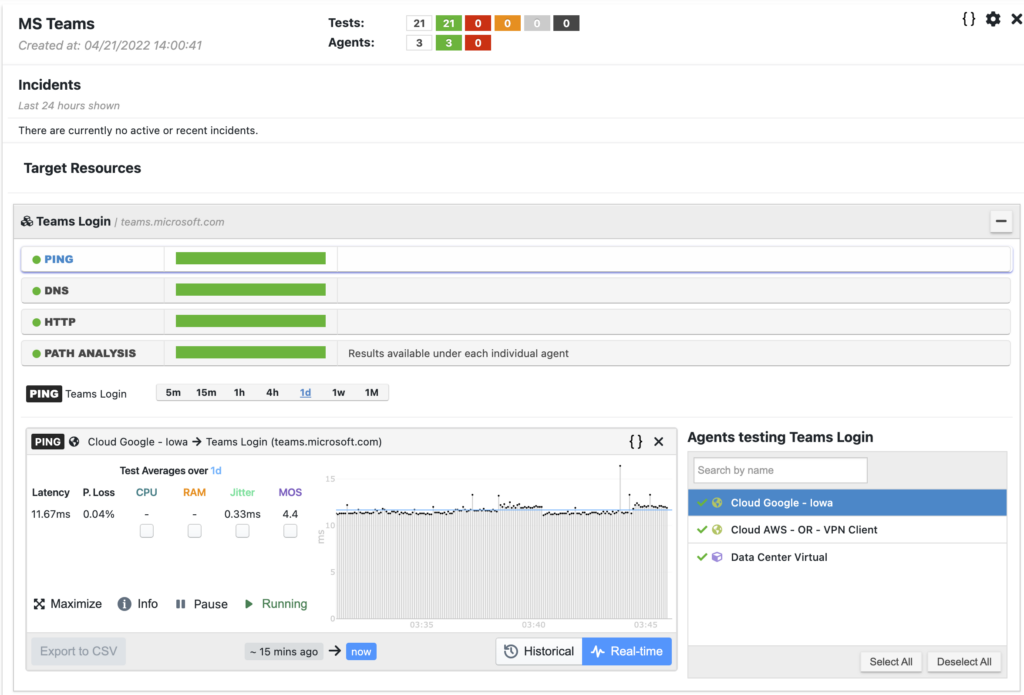
Targets are web or SaaS applications monitored via continuous network monitoring tests. These tests are ping, DNS, HTTP, traceroute and path analysis. They run at regular intervals, expressed in seconds.
Targets provide real-time and historical performance data on internet connectivity, network topology, and more. Performance metrics such as latency, packet loss, DNS and HTTP response times help quickly detect network problems. For example the following screenshot report a target to MS Teams.
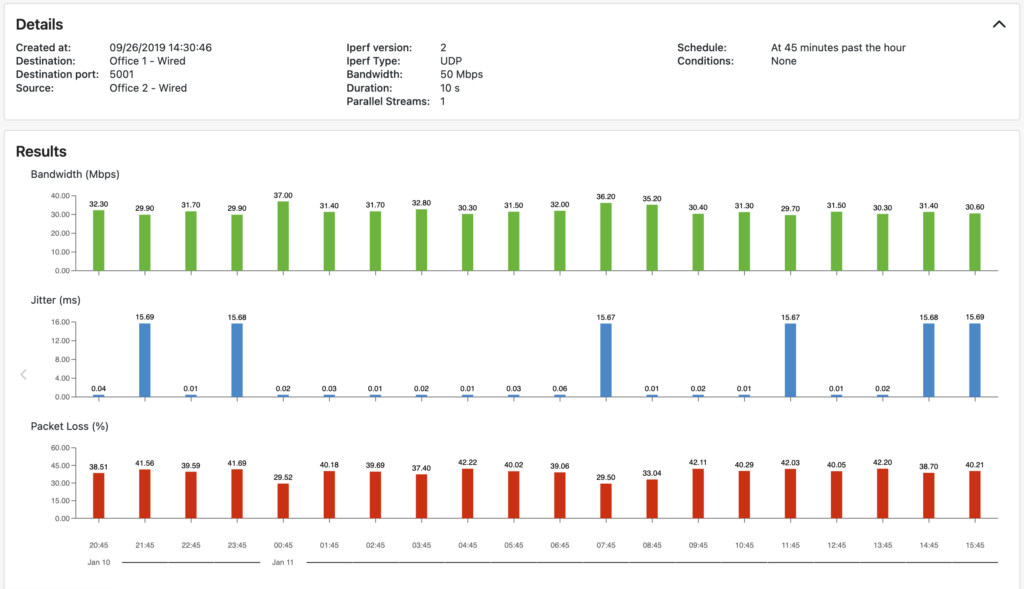
Scheduled tests like iperf, network speed, and VoIP collect network performance metrics such as download and upload speed. These tests run according to a user-defined schedule, such as hourly or daily based on needs. In the following screenshot an iperf test reports throughput, packet loss, and jitter.
Conclusion on network monitoring tools
Network monitoring solutions fall into three categories: SNMP-based, passive, and active. Each type of tools solves a specific network monitoring function within a network infrastructure. To gain optimal network performance, network admins should adopt a tool from each category. If you are looking for an active network monitoring solution that well integrates, try NetBeez by requesting a demo or starting a free trial. With NetBeez you can monitor your entire network, create custom dashboards if needed