Network performance analysis is an activity that entails the data collection and review of key metrics of a telecommunications infrastructure to identify underperforming areas. The network performance data collected is generally obtained from network performance testing tools. The benefits of this activity include cost reduction and improved end-user experience and customer satisfaction. In this article we’ll review what are the factors and metrics that you should consider during a network performance analysis.
The article includes the following sections:
- Benefits of network performance analysis
- Best practices for network performance analysis
- Network performance metrics
- Network performance analysis with NetBeez
- Case studies
Benefits of Network Performance Analysis
The identification of bottlenecks ensures that networks operate at their maximum efficiency. The For this reason, network performance analysis provides a number of key benefits to organizations, such as:
- Improved end-user experience and productivity: A well-performing network translates to faster response times for applications and services, which lead to improved end-user experience and productivity.
- Resource optimization and cost savings: Network performance analysis helps organizations optimize network resources, ensuring efficient bandwidth allocation, including the application of QoS policies.
- Proactive issue resolution: Network performance analysis tools can help organizations identify potential issues before they escalate, allowing IT professionals to address problems before they significantly impact operations, thus reducing downtime.
- Network capacity planning: Network performance analysis provides insights into current network usage patterns, helping organizations plan for future capacity needs and expansions effectively.
- Network troubleshooting and diagnostics: When issues arise, IT professionals can use network performance analysis data to diagnose problems quickly and accurately, reducing Mean Time To Resolution (MTTR).
- Customer satisfaction: For businesses providing online services or applications, a well-performing network contributes to higher customer satisfaction. Users are more likely to engage with services that respond quickly and reliably.
In short, network performance analysis is a critical tool for ensuring that networks function optimally, providing a seamless experience for users, saving costs, enhancing services, and facilitating efficient resource management.
Best Practices for Network Performance Analysis
Ensuring optimal network performance demands a proactive and multifaceted strategy. Here are some recommendations that will benefit network performance and uptime:
- Implement Proactive Monitoring: Adopt network performance monitoring tools that allow to continuously monitoring network performance. A proactive approach empowers early identification of potential bottlenecks and congestion points, enabling quick intervention before performance degradation occurs.
- Prioritize Critical Applications: Implementing Quality of Service (QoS) mechanisms allocates bandwidth prioritization to mission-critical applications. This ensures seamless operation of key activities and enhances overall network responsiveness.
- Maintain System Integrity: Regularly updating and patching network devices and software is essential. This practice mitigates vulnerabilities and optimizes performance by addressing potential bugs and compatibility issues.
- Efficient Resource Utilization: Employing load balancing techniques distributes network traffic evenly across available resources. This prevents overloading any single point, minimizing bottlenecks and maximizing overall network efficiency.
- Continuous Optimization: Network configurations should be continuously analyzed and adjusted to adapt to evolving organizational needs. This ensures the network remains aligned with changing demands and effectively supports business objectives.
By adopting these best practices, organizations can cultivate a robust and reliable network infrastructure that fosters optimal performance and supports efficient digital operations.
Network Performance Metrics
Network performance analysis requires the collection of different performance metrics. In this section, we’ll review the most important network performance metrics, such as:
- Network latency
- Round-trip time
- Packet loss
- Jitter
- Throughput
- Retransmissions
- Path analysis
With each metric described, we will also mention the network performance analysis tools available. Strictly open source and free.
Network latency
Network latency refers to the time it takes for data packets to travel from the source to the destination. This value is measured in milliseconds (ms) and is a critical factor in network performance analysis. There are various factors that impact latency, including the physical distance between the sender and receiver, the number of routers and switches the data packets have to traverse, and the processing time at each network node.

Latency has several contributing factors, such as:
- Propagation Latency: This is the time it takes for a signal to travel from the sender to the receiver and is determined by the distance between them. This value can be approximated with the length of the link divided by 0.6 c where c corresponds to the speed of light.
- Transmission Latency: This is the time it takes to push all the bits of the packet into the network link. Transmission time depends on the congestion of the underlying link.
- Processing Latency: This is the time it takes for intermediate routers, switches, and other networking devices to process the data packet.
- Queuing Latency: This is the time a packet spends waiting in a queue before it can be transmitted. The Quality-of-Service policy configuration applied to the network routers and switches has an impact on this metric.
A utility that runs network latency tests is OWAMP (One-Way Active Measurement Protocol – https://software.internet2.edu/owamp/).
Round-trip time
Round-trip time (RTT) represents the time that it takes for a data packet to go back and forth to a specific destination. The round-trip time value depends on the length of all network links traversed, plus the latency incurred at each hop, including the destination host. For this reason, round-trip time has a high correlation with the type of network (LAN, MAN, etc.).
The following table summarizes expected round-trip time values based on the network type. The principle is pretty simple: longer distances will have higher round-trip times.
| Network type | Average RTT |
|---|---|
| Local Area Network (LAN) | 1 – 5 ms. |
| Metropolitan Area Network (MAN) | 3 – 10 ms. |
| Regional link | 10 – 20 ms. |
| Continental link | 70 – 80 ms. |
| Intercontinental link | 100+ ms. |
The round-trip time value reflects how responsive a TCP-based application (e.g. HTTP) is. In a TCP connection, before a client and a server can start exchanging data, they have to agree on a series of parameters, like the sequence numbers. This process is called a three-way handshake. If we exclude the client and server’s processing delays, the round-trip time is correlated to the amount of time that it takes for a TCP connection to start exchanging application data. Thus, application responsiveness.
The ping command is one of the most used applications for measuring round-trip time.
Packet Loss
Packet loss is calculated as the percentage of packets that are corrupted or not received at all at destination. This key performance metric is a good measure of network quality that reflects its reliability to deliver packets to destination and its error rate. Packet loss is caused by malformed packets being received by the destination, or worse, packets being dropped. It may happen that, along the way between the source and the destination, one or more intermediate routers discard packets due to congested queues. This occurs when routers are receiving more traffic that they can actually transmit (oversubscription).
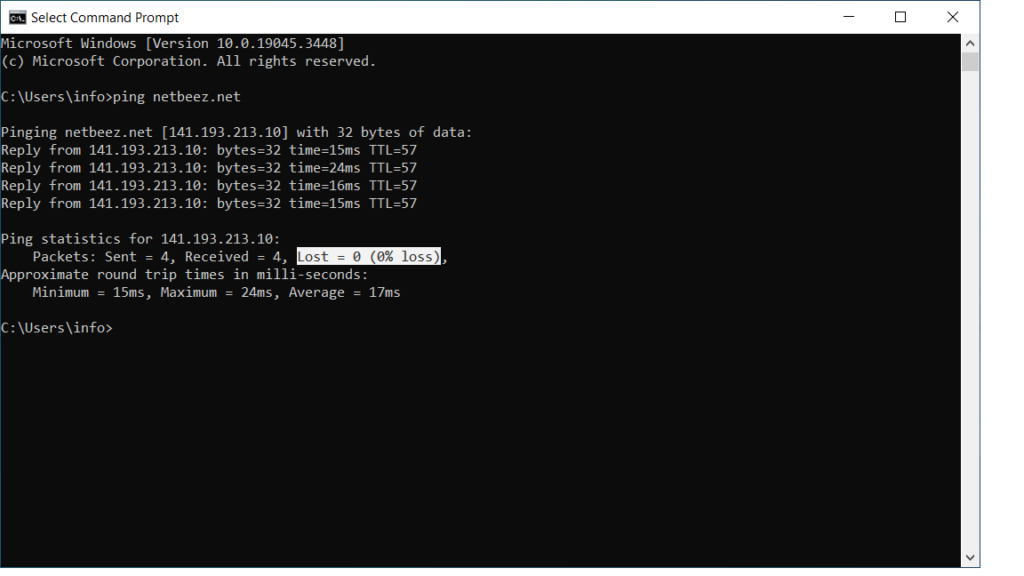
Two commands that are available for testing packet loss are ping and iperf.
Jitter
Jitter is the variation of latency that causes a stream of packets sent at a regular interval to be received at an irregular interval at destination. This metric plays an important role especially for real-time applications such as voice and video calls. When the jitter value is higher than a specific value, it causes degradation of voice calls (choppy sound, metallic voice). The following table summarizes recommended values for jitter as well as latency and packet loss for Voice-over-IP (VoIP) calls. A more in-depth article on VoIP provides a detailed analysis of these metrics.
| Network Metric | Recommended Value | Degraded Value |
| Jitter | Less than 30 ms. | More than 40 ms. |
| Latency | Less than 100 ms. | More than 150 ms. |
| Packet Loss | Less than 2% | More than 10% |
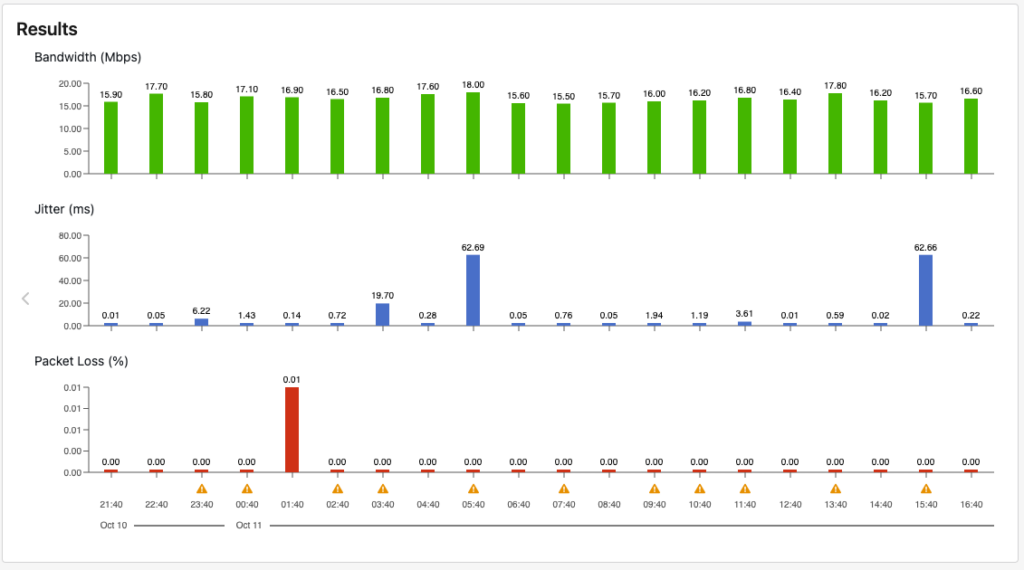
Different network conditions, such as asymmetric routing, network congestion, and equal cost multi-paths can increase jitter. Iperf reports jitter when run in UDP mode. The following screenshot reports iperf results within the NetBeez dashboard.
Retransmissions
Retransmissions happen at the transport layer, or layer 4 of the OSI stack: It’s a metric that is similar to packet loss. When a TCP segment is received malformed, it means that, along the way, some parts of it were not correctly transmitted. This causes the TCP checksum at the destination to not match the value calculated at the source. The TCP of the receiver won’t send an acknowledgement, and the sender will retransmit a new copy of the segment once the transmission timer expires. This impacts data transfer rate. For this reason, retransmissions is another metric often used for network performance analysis. A tool that actively measures this metric is iperf in TCP mode.
Throughput
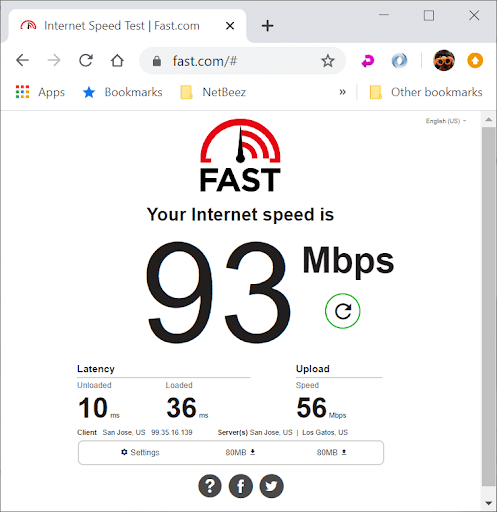
Throughput is the amount of data successfully transferred between a source and a destination host. This value should not be confused with bandwidth nor data rate. Bandwidth, like data rate, is the maximum throughput achievable on a network. It’s generally established by the media and encoding technologies. Throughput is the actual data transfer rate between a sender and a receiver.
There are three core metrics that affect the throughput of a TCP connection: the round-trip time, the packet loss, and the maximum segment size. A good model that describes the relationship of these three variables on throughput is the Mathis Equation. It states that the maximum throughput of a TCP connection can be calculated by dividing Maximum Segment Size (MSS) by RTT and multiplying the result by 1 over the root square of p, where p represents the packet loss. Iperf or speed test generate network traffic and report throughput.
Path Analysis
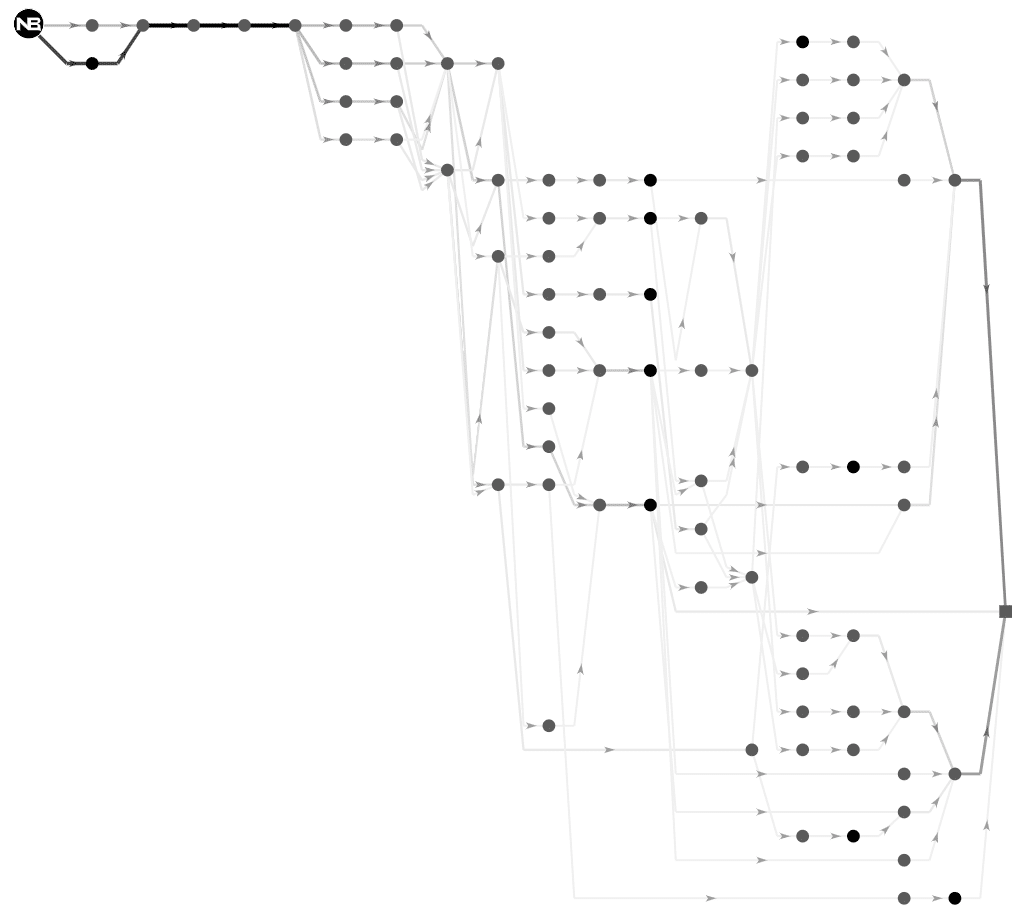
Network performance analysis also involves monitoring changes within the network topology. Routing changes can lead to network performance issues like asymmetric routing, which can negatively impact applications. Engineers often rely on traceroute to find a destination’s path, but it isn’t always precise. For instance, it can’t detect multiple equal cost paths (ECMP) to a destination. To address this limitation, we suggest using path analysis testing. Path analysis works by sending a certain number of concurrent traceroute flows to discover ECMP topologies.
Network Performance Analysis with NetBeez
NetBeez is a monitoring solution used for network performance analysis thanks to its visualization and reporting capabilities. By running continuously active monitoring tests, NetBeez builds an historical baseline of network performance. The following table lists the tests and the performance metrics that are available in NetBeez.
| Test Name | Network Metrics |
| Ping | Round-trip time, packet loss, jitter, MOS |
| DNS | Resolution time, failure rate |
| HTTP | HTTP response time, failure rate |
| Traceroute | Per hop: Round-trip time, MTU |
| Path Analysis | Per hop: Round-trip time, ASN, geolocation |
| Iperf | Bandwidth, packet loss, jitter |
| Network speed | Download, upload, and latency |
| VoIP | MOS, packet loss, jitter, latency |
NetBeez Key Capabilities
Below are the key aspects of how NetBeez contributes to network performance analysis.
Visualization
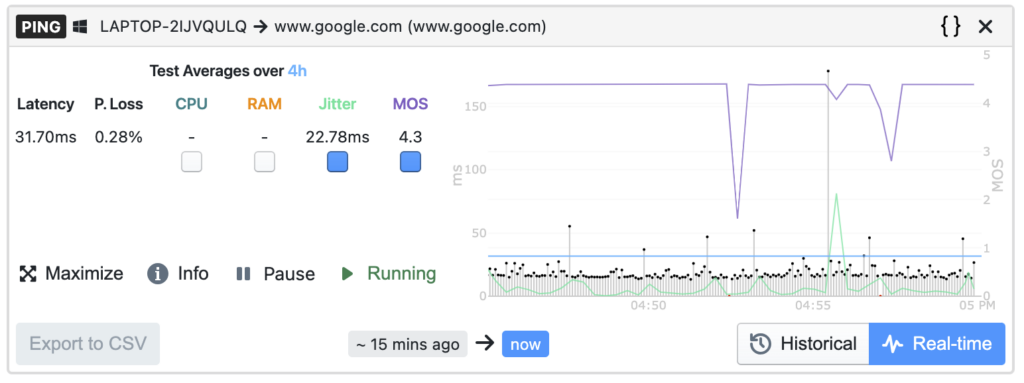
- The user visualizes network metrics as a real time series with historical and statistical (e.g. baseline) analysis.
- The aggregate average chart compares performance averages across all monitoring sensors, represented as a histogram. Each bar in the histogram represents a test run by one individual monitoring sensor for a specific period of time, helping to capture the end-user experience.
- The continuous average chart helps review trends and changes in test performance data over time, providing insights into daily or weekly performance trends like increasing network latency during business hours.
Alerting and Reporting
- The server stores the data collected in a database as a time series, allowing for analysis and comparison to discover trends and patterns like daily, weekly, or monthly fluctuations or to spot underperforming assets.
- The alerting functionality can notify the network administrator when the error rate of a test is above a certain threshold (e.g. packet loss > 3%), or the network response time has increased compared to the normal baseline.
- The reports include graphs, tables, and charts related to network availability and application performance, offering a clear view of the entire network and applications.
Actionable Insights
- By analyzing the performance metrics, network administrators can take action to optimize the network configuration at underperforming locations, possibly enabling Quality of Service (QoS) or replacing network hardware to improve performance.
- The user can create alerts when a network metric, or its baseline, crosses a certain value or secondary baseline. Alerts can then send emails, generate webhooks, trigger other notifications, or integration actions to alert the network administrator.
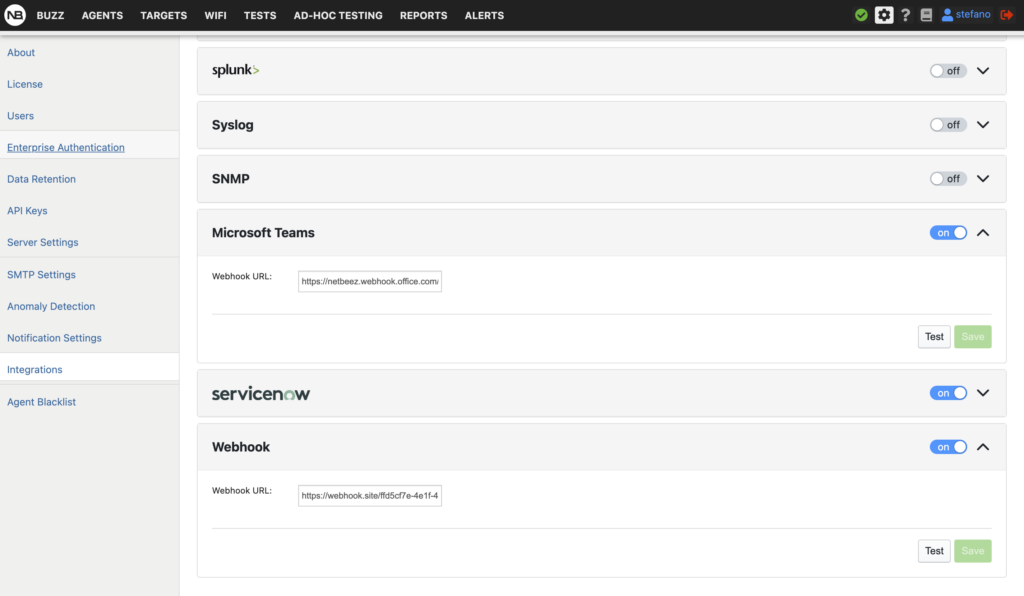
NetBeez, through its network monitoring tool, provides a robust platform for network analysis by offering detailed reporting, visualizations, and analysis of performance metrics, thus enabling network administrators to identify, analyze, and resolve network problems effectively.
Case Studies/Examples
The following are just a few examples of how network operations teams use NetBeez to improve network performance in a variety of industries. NetBeez can help any organization that relies on networks to operate efficiently and deliver high-quality services to its customers or employees.
Financial Services: Ensuring Network Reliability for Critical Trading Systems
Financial services companies rely on high-performance networks to execute trades quickly and accurately. Even a small amount of downtime can result in significant financial losses. NetBeez helps financial services companies ensure that their networks are reliable and available by providing real-time monitoring and insights into network performance.
For example, one financial services company used NetBeez to monitor the performance of its internal network and measure the impact of network changes. On many occasions, NetBeez detected network issues after a configuration change was applied to the network and alerted the IT staff. The network team was able to address the issue before users noticed anything.
Healthcare: Delivering High-Quality Patient Care with Reliable Networks
Healthcare providers rely on networks to deliver a wide range of services, including electronic health records (EHRs), telemedicine, and medical imaging. Wireless network issues can disrupt patient care and lead to serious consequences. Several healthcare providers use NetBeez to ensure that their networks are reliable and available by providing real-time monitoring and insights into network performance.
For example, one large healthcare provider in Utah uses NetBeez to monitor network availability and performance of its hospitals and clinics. NetBeez identified a network problem with the wireless network that was causing VoIP calls to drop. The company was able to reduce root cause analysis by 75% .
Education: Enabling Online Learning with Reliable Networks
University of Rhode Island (URI) was experiencing frequent Wi-Fi disconnections and overall performance issues with online learning applications. The problems were especially acute when students were attending online classes and taking exams. The network team was unable to dedicate engineers 24/7 to monitor problematic connections in order to successfully diagnose the surge in help-desk tickets.
After implementing NetBeez, URI was able to quickly identify and resolve the root causes of their Wi-Fi problems. NetBeez provided the network team with real-time visibility into network performance and insights into the behavior of individual devices and applications. This information enabled the team to troubleshoot issues more quickly and effectively.
As a result of using NetBeez, URI was able to improve the performance of their Wi-Fi network significantly. Students are now able to attend online classes and take exams without experiencing disruptions. The network team is also able to resolve issues more quickly and efficiently.
Conclusion
With robust network analysis, organizations can significantly enhance network performance. NetBeez stands as a reliable tool for network performance measurement and analysis, offering a plethora of features for comprehensive network analysis. If you want to learn more about NetBeez network monitoring, request a demo.


