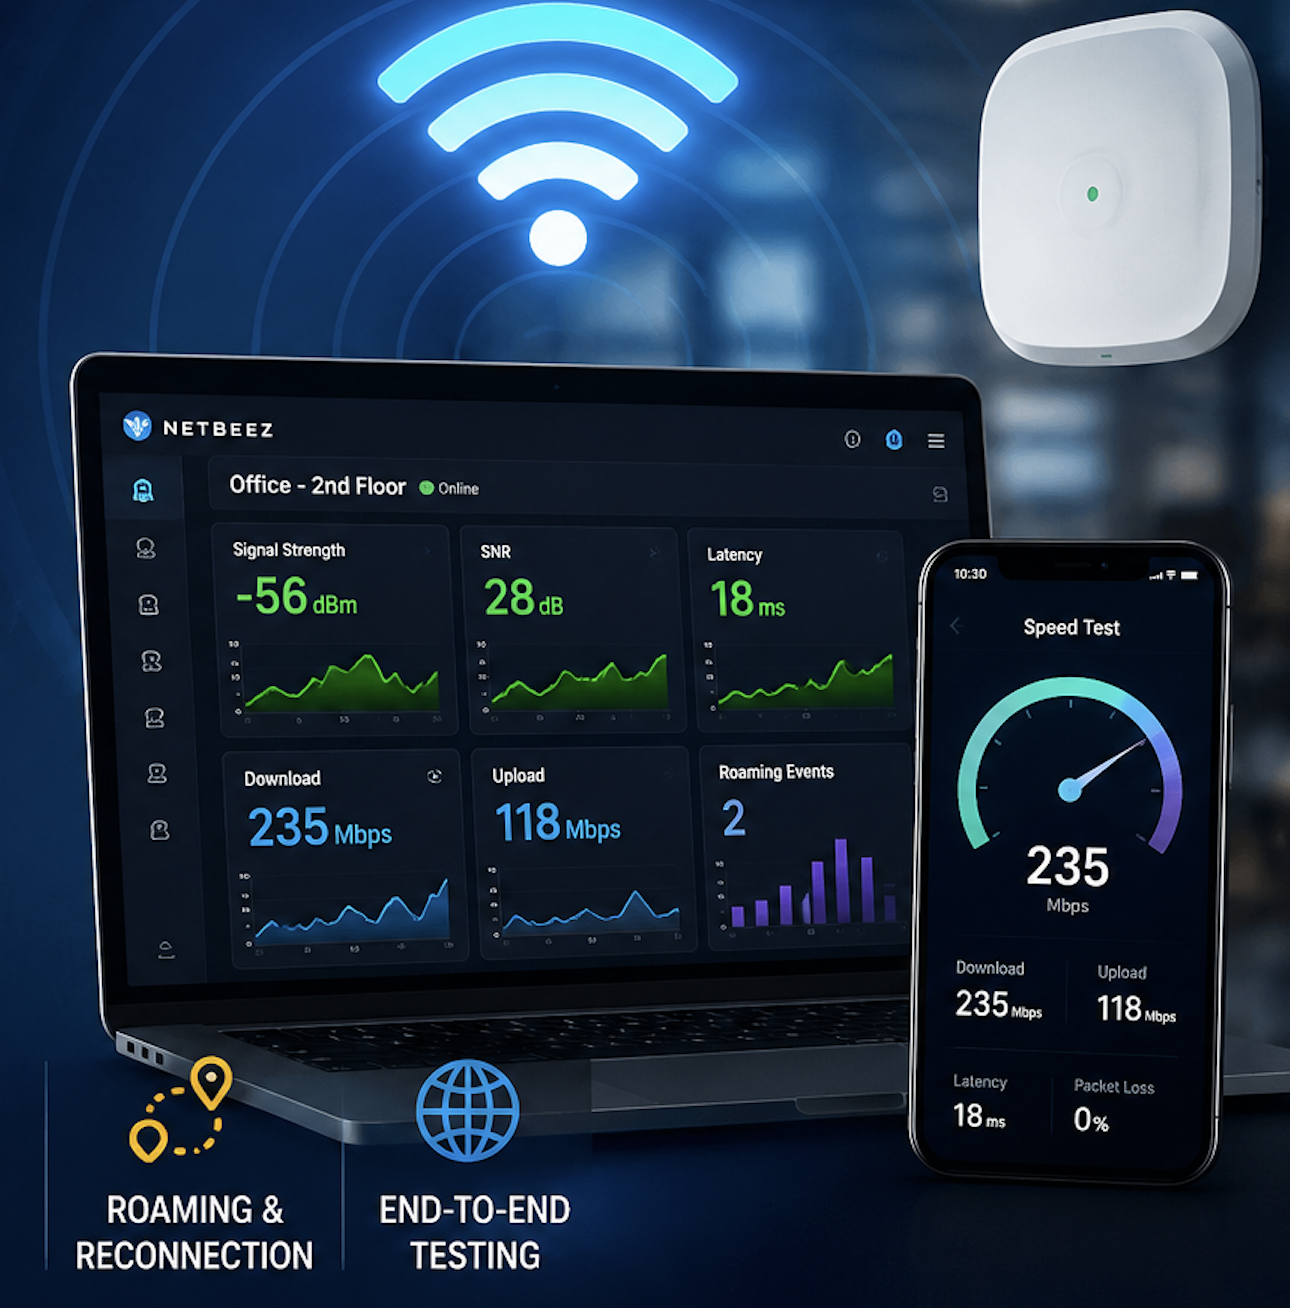
What NetBeez Does
NetBeez captures network and application performance (e.g. latency increase) from the user perspective on wired and wireless networks. Sensors at each network location run tests and simulate the user experience. We have dozens of demo NetBeez agents deployed around the country and the world and we collect some interesting data. Here is what I discovered recently while troubleshooting a NetBeez alert.
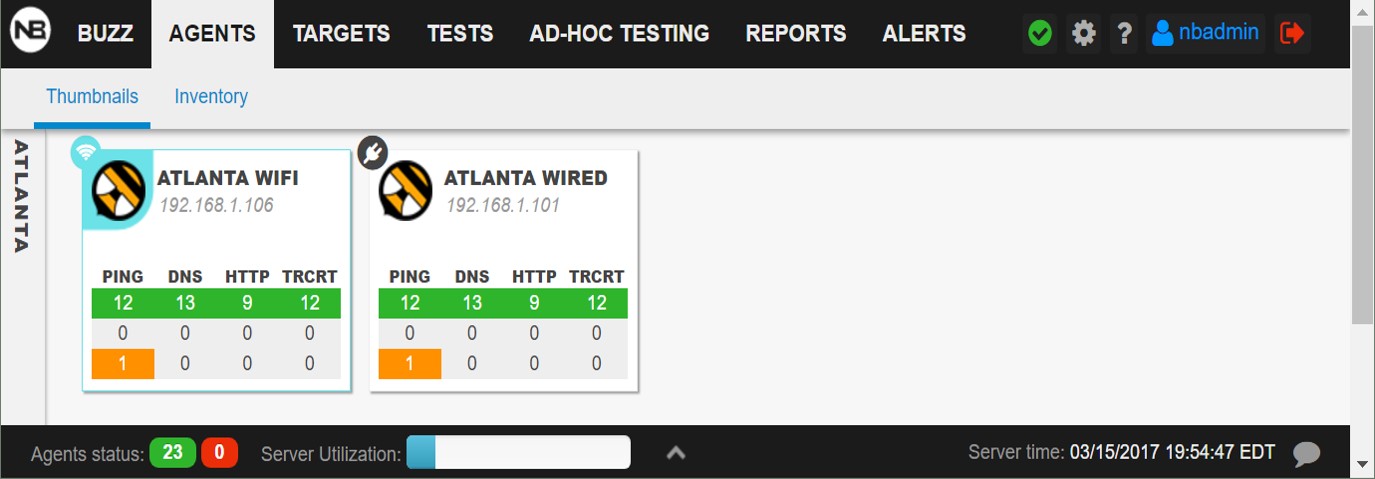
A typical NetBeez setup has a pair of agents, one wired and one wireless, at each office in order to capture the performance of both networks.
I received an email with the following alerts:
| 03/15/2017 1:50:57 PM PING Atlanta WiFi mail.google.com Warning Raised: The 1 hour mean metric (45.33ms) is greater than the 1 month mean metric (15.10ms) by at least 3 times. |
| 03/15/2017 1:49:05 PM PING Atlanta Wired mail.google.com Warning Raised: The 1 hour mean metric (35.32ms) is greater than the 1 month mean metric (11.65ms) by at least 3 times. |
Almost at the same time, both the wired and wireless agents in the Atlanta office started experiencing an increase in latency at mail.google.com
Troubleshooting Network Latency Issues
I looked at the dashboard and these were the only two alerts on the Atlanta agents.
The historical latency for both agents (shown below) show that their performance patterns are almost identical.
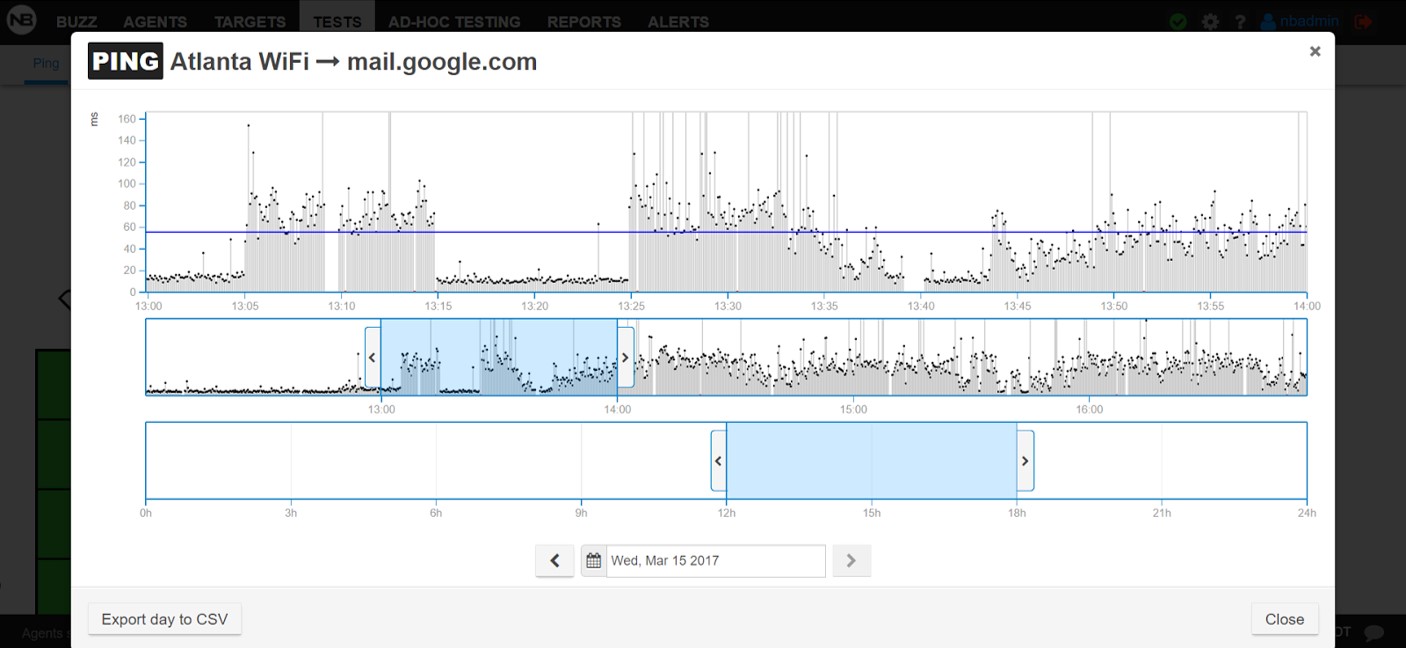
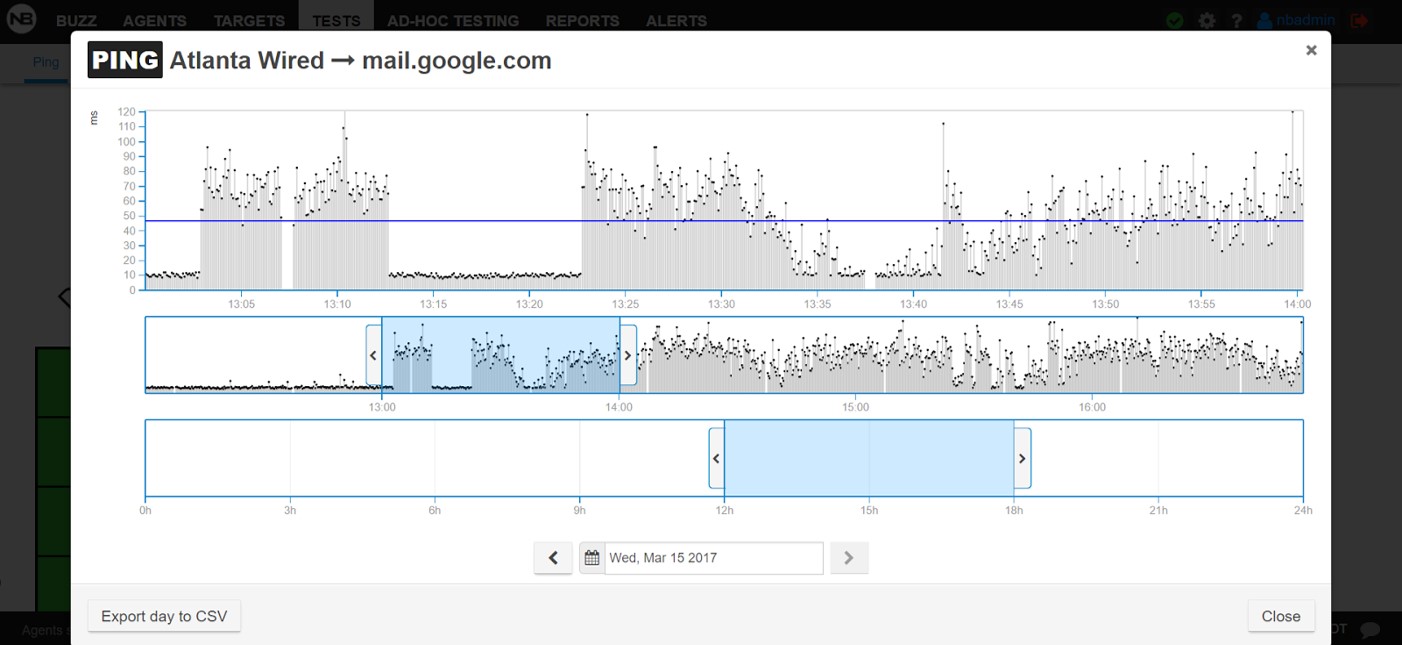
1st conclusion: The increased latency is not related to the wireless network.
Explanation: Most users today are on WiFi and when they have poor experience on their devices, one of the first questions we need to answer is whether or not WiFi is the culprit. In this case, since the wired and the wireless agents show the same behavior, the problem cannot be pinned on the wireless network. It has to do with the backhaul.
The next obvious question is whether this increased latency issue is limited Atlanta or is more widespread. A quick inspection of the latency grid view shows the following:
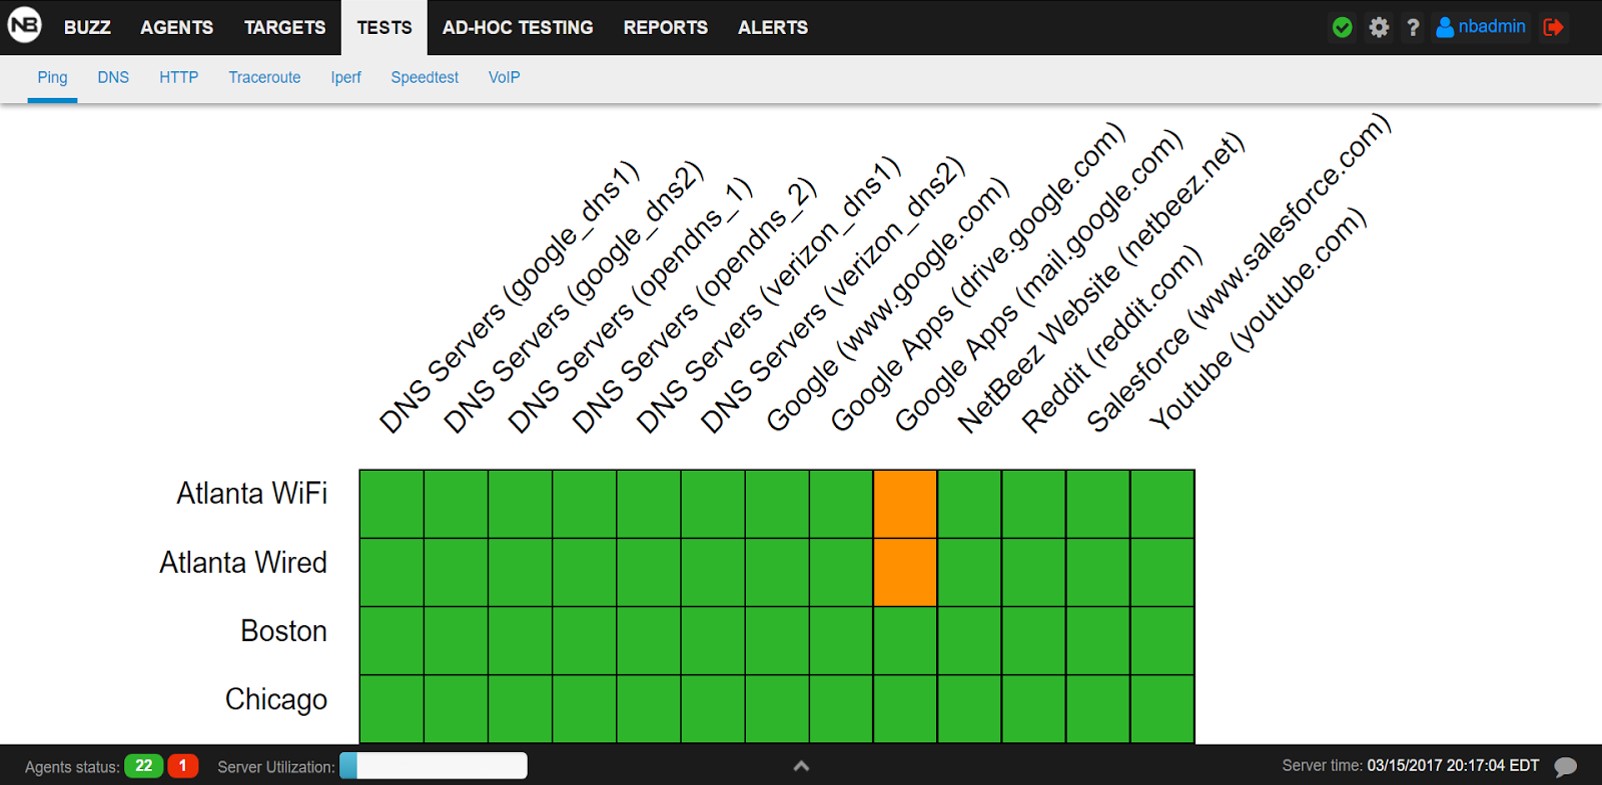
2nd conclusion: The increased latency only affects users in Atlanta
Explanation: This is obvious from the above grid view. In addition, none of the other tests from the Atlanta office have any issues.
A more interesting view comes from the traceroute results from the WiFi Atlanta agent to mail.google.com:
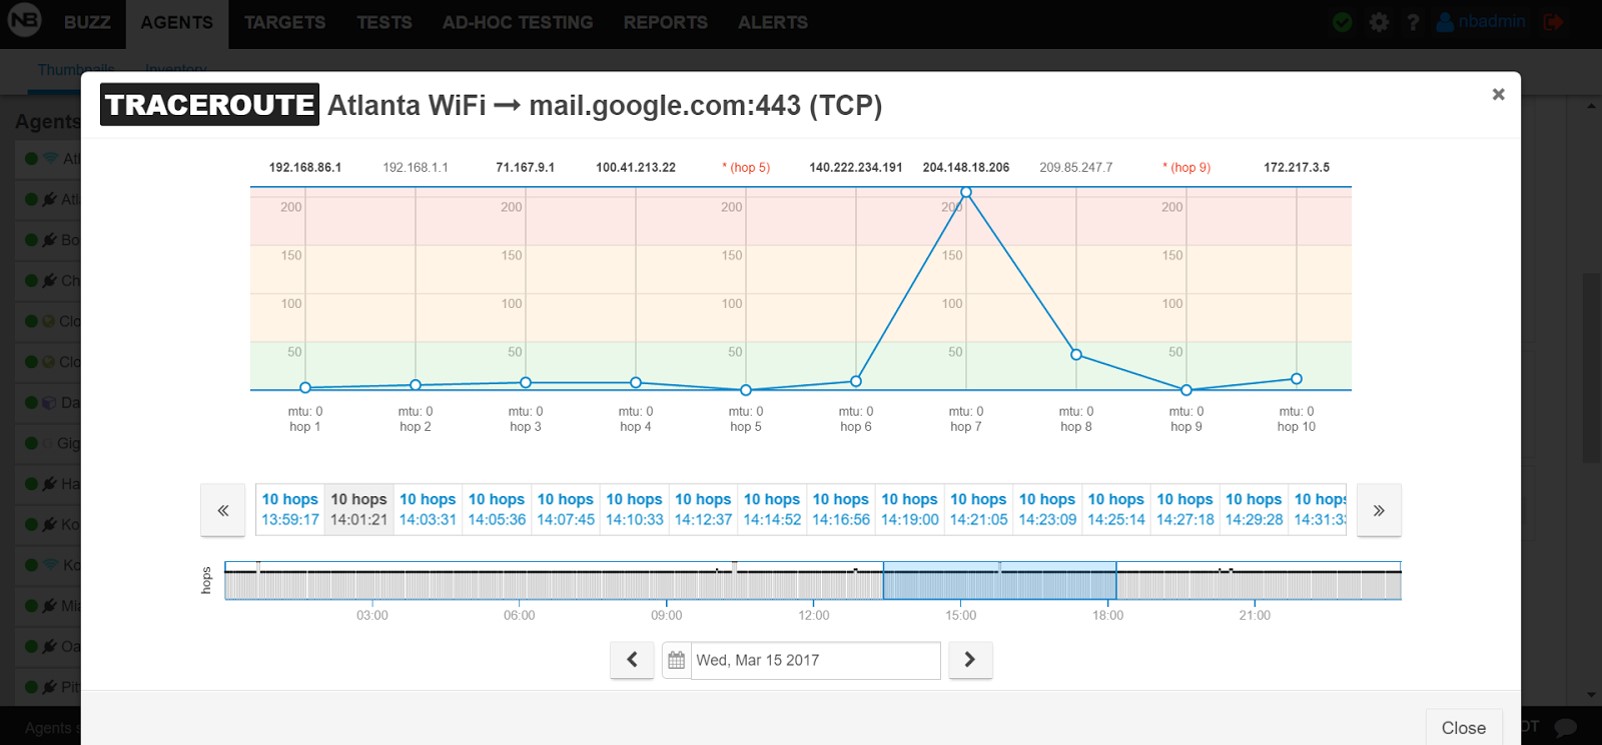
As we can see, there is one hop that exhibits much higher response time than all the others. By inspecting the traceroute results before, during, and after the event (not shown here), it was clear that the increased response time at the specific hop occurred only during the event.
3rd conclusion: The issue has to do with an increased response time by a hop between Atlanta and mail.google.com
One question is why don’t we see other locations, (e.g. Boston, Chicago), exhibiting high latency? The routing path followed by Atlanta was the only one going through the hop with the increased latency, and this is why none of the other locations triggered any alerts.
This latency increase went away six hours later, and there were no major issues in terms of the application user experience. Although the increased latency was more than three times the normal levels, its overall impact on the mail application response time wasn’t significant or noticeable by end users. However, this is not always the case, and latency increases of this kind are often precursors of larger issues. It’s important to be able to catch them as soon as they occur.
Conclusion
This is just one use case of distributed network monitoring for wired and wireless data. The information gathered from multiple sensors gives us the user perspective information on the NetBeez dashboard that allows proactive network monitoring. There are many others that we’ll cover in following posts.