What’s a WAN?
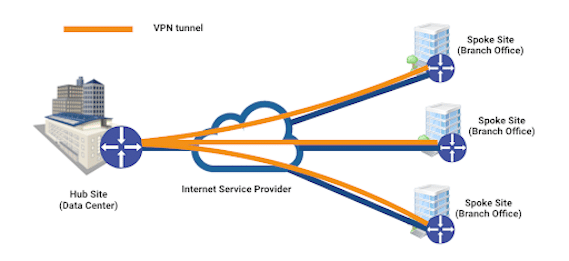
A Wide Area Network (WAN) enables organizations to provide network connectivity to their remote locations, permitting its employees and customers to access on-premise and public applications in a secure way. Think, for instance, about the branch offices of a bank, or the retail locations of any supermarket. As a result, a WAN is a key asset for an organization as it supports critical business and digital operations.
WAN Limits
Traditional WAN networks have several limits for organizations that are distributed. Think about a global company that has offices all over the world. In this case, to build its WAN network, the company relies on dedicated network services that are expensive and not always available. SD-WAN removes this limit by using overlay tunnels across a regular internet connection. The overlay tunnels establish between the service provider’s Points of Presence (POP) and an organization’s edge devices. However, the issue with overlay tunnels is that they reduce visibility of a traditional WAN monitoring tool.

Network architects and executives that are moving to an SD-WAN solution, need to consider key network monitoring requirements to support their users. In the next sections we’ll cover the following topics:
SD-WAN Definition
A Software Defined Wide Area Network (SD-WAN) is a networking technology that enables software defined configuration and management. The SD-WAN software includes functions to improve network performance and network reliability of WAN networks via traffic analysis. As the acronym states, this technology is particularly used in Wide Area Networks, which is a telecommunications network that extends over a large geographic area.
SD-WAN Benefits
When compared to a traditional WAN architecture, SD-WAN enables enterprises to reduce CapEx and OpEx (such as connectivity costs) while centralizing network management and policy enforcement. More specifically, there are three key advantages of SD-WAN over legacy WAN architectures.
Network Optimization with Dynamic Path Selection
Traffic is automatically adjusted based on network congestion and other conditions. It’s possible, for example, to dynamically distribute connections amongst multiple links to make best use of Direct Internet Access, MPLS, and LTE/5G connections. Load balancing can be configured per-flow, and some vendors even support per-packet basis. Traffic control can be based on jitter, latency, and packet loss.These values are measured in real-time via special performance probes, generally implemented with UDP packets.
Policy Based Routing
SD-WAN controllers enable centrally defined network policies to orchestrate traffic to and from WAN locations. For example, real-time traffic such as Voice-over-IP (VoIP) can be set to use low latency MPLS circuits, while bandwidth intensive applications can be routed over Internet connections. Traffic shaping policies can be applied to traffic destined to public cloud providers to use the desired interconnects.
Simplified Configuration
Configuring an SD-WAN is mostly UI-driven, rather than requiring the network engineer to master a command line interface. Bandwidth management and traffic control are entirely software-defined while many network functions, like firewalls, DNS and caching, are virtualized (NFV).
Some of the advantages of SD-WAN however introduce new challenges to infrastructure and operation (I&O) teams.
SD-WAN Monitoring Challenges
SD-WAN and multi-cloud adoption pose new challenges to I&O teams’ ability to successfully and efficiently manage their WAN and support the end-users. We identified three key challenges that these teams should consider:
- Split tunnel reduces visibility to Internet resources and public clouds.
- Path remediation and failover don’t take into account the end-user experience.
- Virtualization impairs troubleshooting of remote performance issues.
Split tunnel reduces visibility to Internet resources and public clouds
In a split tunnel configuration, a remote site has a direct Internet connection to reach public networks and a private connection to reach corporate resources (intranet). The private connection is established between the branch router and the company’s data center via a VPN tunnel or MPLS connection.
Split tunnels limit the efficacy of centralized network monitoring solutions that cannot detect reachability or application performance degradation issues impacting users at remote sites. This is because the monitoring server is located at the data center.
Path remediation and failover don’t take into account the end-user experience
Path remediation and automatic failover enables multi-home routers to direct traffic based on the quality and reliability of underlying links. Performance probes used to implement link quality verification only consider the “last mile”. For example, the router may route traffic across a link with no packet loss but with a lower data rate, slowing down the overall connection.
Path remediation and failover could have a local significance but negatively affect the overall end-to-end performance. For instance, packet duplication reduces the overall bandwidth available to users. As a result, applications may perform slower than before the corrective action which drives user complaints.
Virtualization impairs troubleshooting of remote performance issues
SD-WAN routers use passive application performance monitoring to identify and profile the applications that traverse their interfaces, prioritize mission-critical data and optimize routing decisions. While this level of monitoring is key for an SD-WAN router to make routing decisions on its multiple network links, it doesn’t provide a good estimate of end-user experience.
To troubleshoot remote performance issues, multiple components should be considered including:
- the WiFi network
- the LAN
- the client itself
- the configuration of the SD-WAN appliance
- the WAN/Internet links
SD-WAN solutions provide valuable information and analytics about the traffic that flows through their interfaces. Without end-to-end metrics (such as network latency, packet loss, DNS resolution time, and HTTP loading time from the user layer), it becomes very difficult to efficiently troubleshoot remote performance issues.
Required SD-WAN Monitoring Capabilities
SD-WAN and multi-cloud adoption impose new monitoring capabilities, which legacy network solutions based on SNMP don’t offer. In fact, these types of solutions have two major limitations that impact their efficacy:
- They are centralized: the server runs and performs the monitoring from the data center.
- They are device oriented: report the status and resources available of network devices.
To address new network monitoring demands, we have identified two primary requirements that every organization should consider with SD-WAN and multi-cloud deployment:
Distributed network monitoring
Network monitoring should be performed at every location that is company-owned and/or operated. This includes locations that provide network services to corporate employees (WAN sites and headquarters), host information systems and customer-facing services (data centers and public clouds). By collecting data from the locations where traffic originates and terminates, it’s possible to accurately detect and troubleshoot network and application performance issues.
For example, having a monitoring agent at a WAN location and another in a public cloud, it’s possible to verify that the network can deliver the expected throughput and performance to users accessing cloud services.
Active network monitoring with end-to-end tests
Active network monitoring with end-to-end tests verifies reachability and measures performance to network services and applications. This approach is very similar to service assurance delivered by IP SLA tests configured on network devices. The difference here is that tests run from the user layer and target private or SaaS applications. IP SLA are mostly network centric tests to manage routers’ performance. This method enables the detection of network failures or performance issues without relying on user tickets.
IT organizations that are moving to a SD-WAN and multi-cloud should deploy network monitoring solutions that meet these two requirements.
SD-WAN Performance Testing
To overcome the obfuscation introduce by SD-WAN overlay network, it’s necessary to rethink SD-WAN performance testing. Traditional WAN monitoring tools that are based on SNMP provide limited network visibility. For SD-WAN environments, IT needs a network performance management solution that runs end-to-end, synthetic network tests from the user perspective. It provide useful data to troubleshoot situations like the one illustrated earlier. At minimum, a network monitoring tool should collect the following metrics:
- Latency and packet loss to the remote application server (ICMP or TCP-based ping)
- Jitter for voice and video communications (UDP iperf)
- Number of network hops and path changes (traceroute or path analysis)
- Throughput to other WAN sites and to the Internet (iperf, NDT and speed test)

SD-WAN solutions may report some of these metrics, but they’re either passive or only take into consideration a limited portion of the network. This typically is the last mile where the SD-WAN appliances operate.
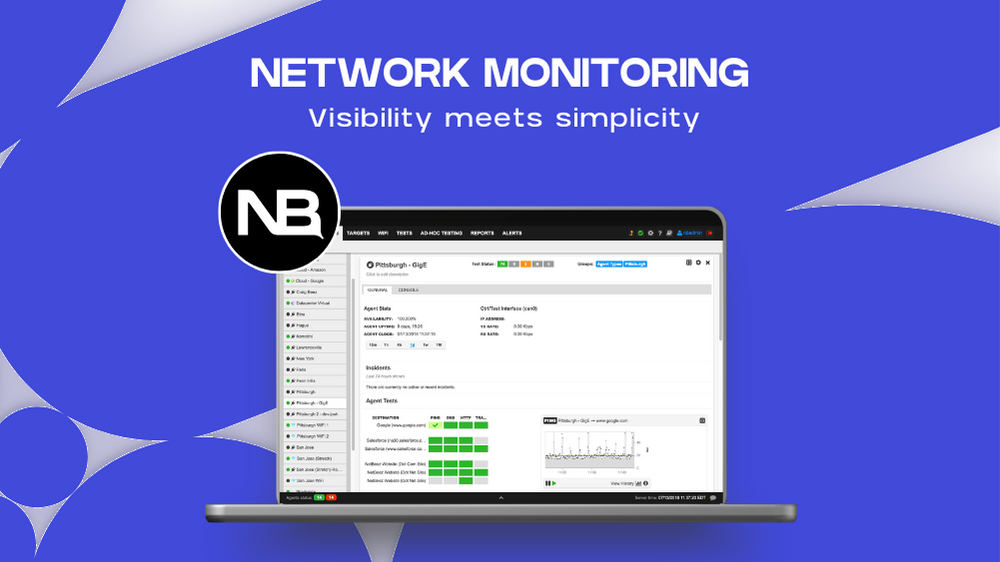
A network monitoring tool like NetBeez for SD-WAN takes into account the whole end-to-end experience, from the user layer to the far end destination. Such a monitoring solution, relies on active network monitoring agents that are installed at the edge, either as a physical or a virtual appliance. The end-to-end network tests are run continuously, and results are retrieved in real-time and stored for historical review.
End-User Experience Monitoring
Monitoring the end-user experience is another key element of an SD-WAN monitoring solution. There are many ways to capture the end-user experience, and a variety of tools in the market that aim to do so. Typically, end-user experience monitoring includes application-layer statistics and metrics such as:
- DNS resolution time
- HTTP loading time
- Mean Opinion Score (MOS) for VoIP
- WiFi performance metrics

How NetBeez Supports SD WAN and Multi-Cloud Adoption
NetBeez is a distributed network monitoring system that meets critical SD-WAN and multi-cloud requirements. Remote physical and software agents run active, end-to-end monitoring tests at any on-prem and cloud location. These capabilities enable I&O teams to quickly detect and troubleshoot remote network problems, reducing unnecessary downtime and the wasteful deployment of skilled personnel.

Moreover, NetBeez provides these additional capabilities:
- Real-time data feeds: Within seconds remote monitoring agents report telemetry data to a centralized dashboard controller for alert processing and analytics. Having real-time data allows quick analysis and alert detections within seconds versus the minutes of delay inherent with legacy monitoring solutions. This capability is key to reduce the time to detect and repair remote network issues.
- Telemetry raw data versus sampled flow data: Raw data streams provide a better context and more granular visibility into remote network and application performance issues. This level of detail delivers valuable insight regarding frequency and enhances the identification of intermittent problems which could be caused by factors beyond the network.
- Ease of installation, support for any network, integrations: NetBeez monitoring agents are easy to install and support any network environment, whether on-premise or cloud. The physical sensors are plugged into switches (Gigabit Ethernet) and/or connect to a 802.11 access point. The software agents support Linux and Windows operating systems, virtualization (VMware, HyperV, KVM, …) as well as Docker. They also integrate with leading infrastructure vendors, such as Cisco, Extreme Networks, and Juniper.
In three simple steps, network administrators install the agents, configure the network monitoring tests, including the notifications and alerting. You can start a free trial if you want to evaluate NetBeez.
Step 1 – Deploy network monitoring sensors
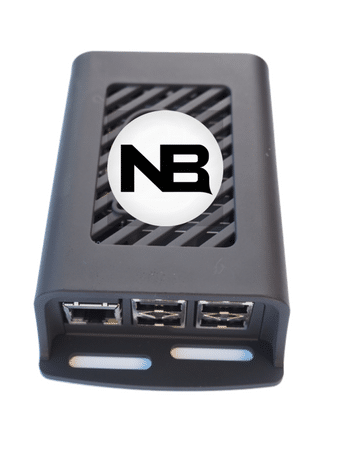
In this initial step, the network administrator installs the network monitoring agents. NetBeez Network Agents are hardware, virtual, docker, or software appliances meant to run at remote branch offices. Hardware agents can be plugged into the access switch at the branch, while the virtual or software ones can be installed on the SD-WAN router if supported. The data collected by these units will help network administrators understand what is the overall internet performance at each remote SD-WAN branch.

Step 2 – Create network monitoring targets and speed tests
NetBeez offers two complementary methods for monitoring SD-WAN performance:
- Targets that include tests like continuous monitoring tests such as ping, DNS, HTTP, traceroute and path analysis. These tests run at regular intervals, providing real-time and historical performance data on internet connectivity. Metrics such as latency, packet loss, DNS resolution time and HTTP performance are crucial for proactive detecting intermittent or complete loss of connectivity.
- Scheduled tests such as network speed and iperf provide download and upload speed against internet servers and cloud locations. These tests run according to a user-defined schedule, such as hourly or daily based on needs.
Step 3 – Configure alerts and notifications methods
The last important step of the configuration is to enable notifications when NetBeez finds anomalies in the network. By default, NetBeez generates alerts either when a target detects a loss of connectivity with ping, or a service interruption with DNS and HTTP.
NetBeez also supports performance alerts by comparing a short-term moving average with a fixed value or to a long-term baseline. This simplifies SLA enforcements or smart detection of performance degradation. Notifications enable network administrators and support teams to get an email or some other events when an alert is triggered.

NetBeez can send notifications via standard protocols such as SMTP, SNMP, Syslog, and webhooks. It also supports out-of-the-box integrations with third-party systems such as ServiceNow, MS Teams, Slack, and PagerDuty.
SD-WAN connectivity metrics available in NetBeez
To conclude, NetBeez provides comprehensive metrics to monitor status and performance of SD-WAN connections, such as:
- Latency
- Packet loss
- Jitter
- Download and upload speed
These metrics matched with real-time alerts and historical analysis are crucial to proactively detect SD-WAN performance and connectivity issues, cutting troubleshooting time. Request a demo to learn more about NetBeez.
Conclusion
Today’s Wide Area Networks are far larger, more complex and more dynamic than ever before. Driven by the adoption of SD-WAN and multi-cloud, the WAN has outgrown the capabilities of traditional network monitoring solutions. IT organizations that want to be agile need to include network monitoring in the scope of work for any SD-WAN and multi-cloud project.
Network monitoring solutions should support distributed agents that perform active, end-to-end performance measurements. These capabilities enable Infrastructure & Operations teams to efficiently manage and support the network and its users.
NetBeez is a network performance monitoring tool that caters to the recent demands of modern WAN. Its key capabilities that enable network teams to gain the full benefits of SD-WANs and multi-cloud deployments. NetBeez provides a simple interface and plug-and-play deployment to monitor SD-WAN from the user perspective. If you want to test NetBeez, request a demo.


