I am excited to announce that NetBeez released WiFi monitoring endpoints for Windows and macOS systems as part of the latest software update 7.0. In the same release we also included jitter and Mean Opinion Score (MOS) estimates for ping tests. This new version of NetBeez offers many benefits to IT operations teams that adopted NetBeez’s remote worker network monitoring. Let me share with you more details about these new features.
WiFi Performance and End-User Experience
Bad WiFi connectivity is one of the major causes of remote worker’s performance issues. As a result, to successfully troubleshoot the end-user experience of work from home users it’s important to collect Wi-Fi performance data.
In the below chart you can see results of a simple test that we did with a Mac laptop wirelessly connected. During the test, we collected the WiFI RSSI, noise, and MCS values before and after the removal of a wireless repeater. When the repeater was removed, the WiFi signal strength (RSSI) and MCS value dropped substantially, reducing at the same the client’s network speed. The quality of Zoom calls was also impacted.
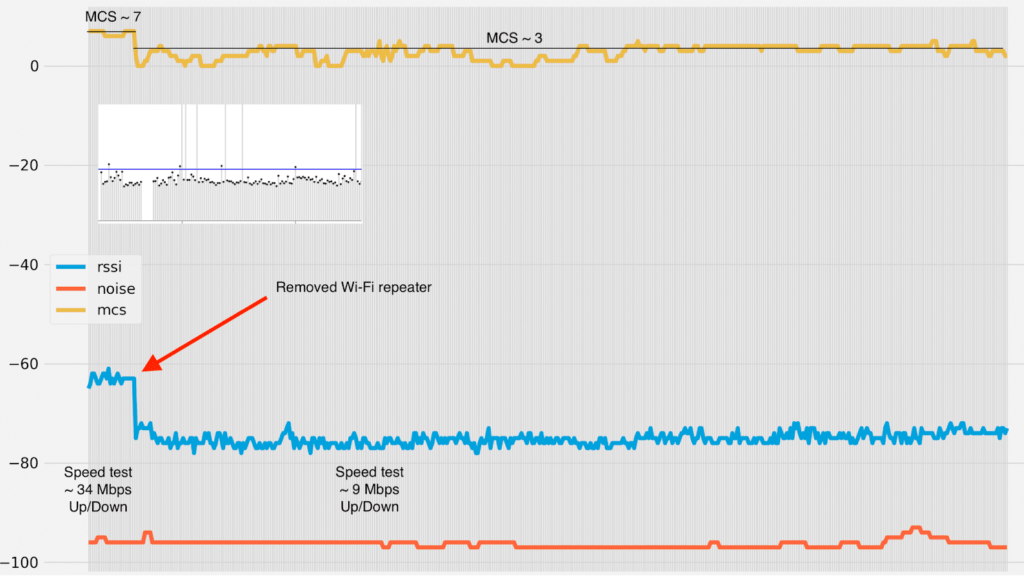
The above test case proved the importance of collecting WiFi data directly from endpoints. Since this was also one of the most requested features by NetBeez customers, we decided to prioritize WiFi monitoring for remote worker agents and release it in the first quarter of 2021.
WiFi Support for Remote Worker Agents
The WiFi data provided by the macOS and Windows operating systems is very valuable for troubleshooting WFH end-user experience issues. One thing that we noticed though is that the Windows and macOS operating systems don’t report the same data. The table below lists all the metrics available based on the operating system where the remote worker agent is running on.
Metric | Data Type | Windows | macOS |
| Tx/Rx Data | Bps (number) | ✔ | ✔ |
| SSID | String up to 32 chars | ✔ | ✔ |
| BSSID | HEX string similar to MAC address | ✔ | ✔ |
| Signal Strength | dBm (RSSI) | ✔ | ✔ |
| Noise | dBm | ╳ | ✔ |
| Link Quality | % | ✔ | ╳ |
| Bitrate | Mbps | ✔ | ✔ |
| Channel |
Numerical value based on band
| ✔ | ✔ |
| Channel Frequency | GHz (https://en.wikipedia.org/wiki/List_of_WLAN_channels) | ✔ | ✔ |
| MCS | Integer value between 0 and 31 | ╳ | ✔ |
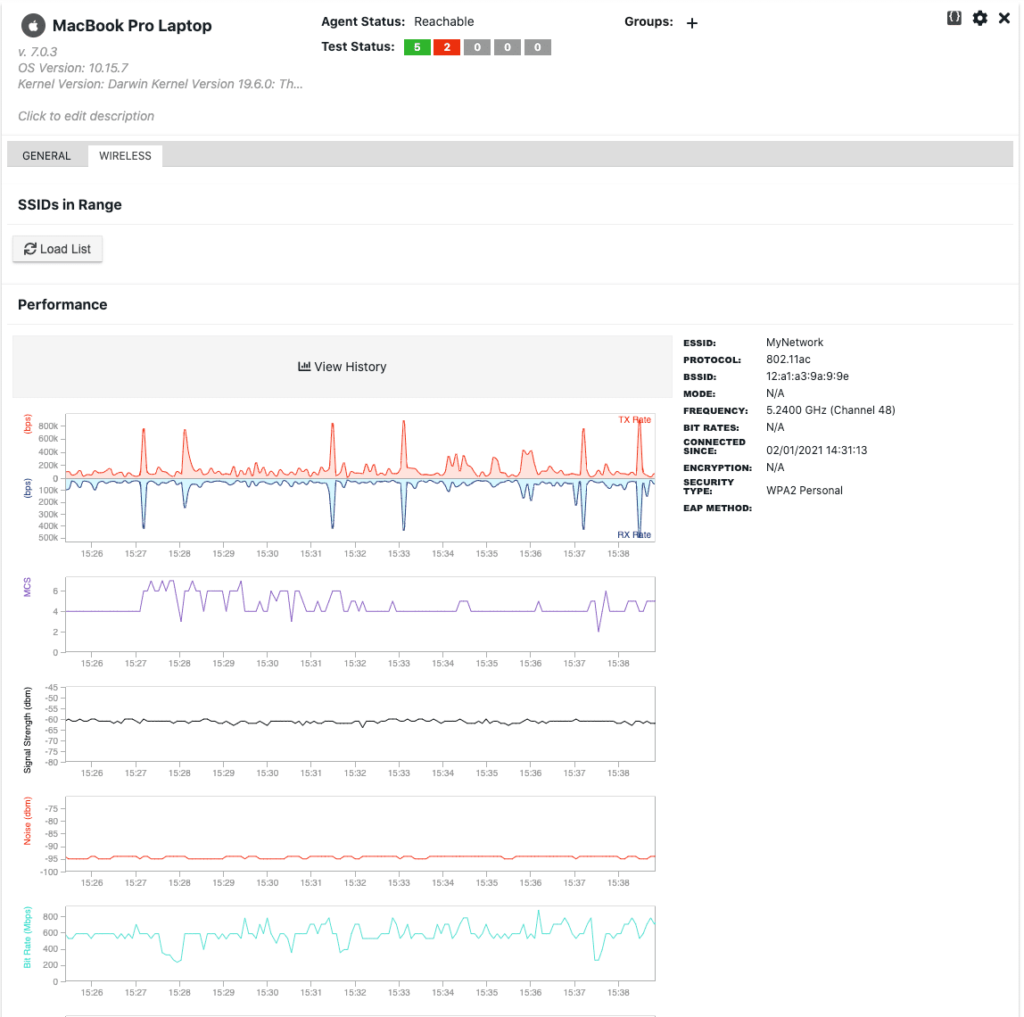
In both cases, the Wi-Fi metrics collected by the NetBeez agent are sent in real-time to the server. The data is then displayed on the user dashboard under an agent’s details view. The data is also stored in the database for historical review and available based on the data retention period defined by the user.
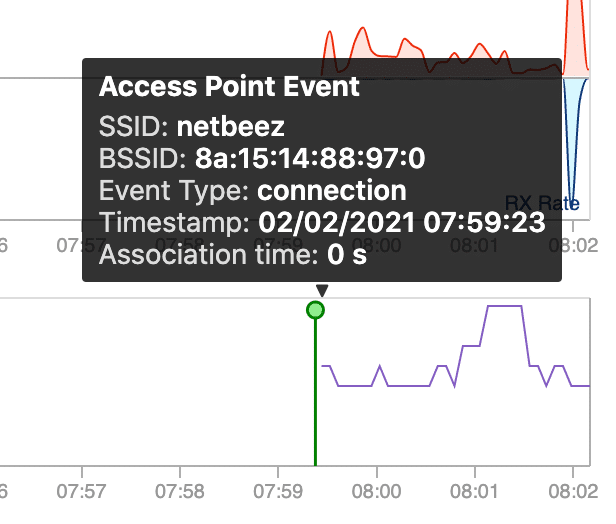
NetBeez remote worker agents also report connection and disconnection events to the dashboard. This information is valuable in many cases as it tells the network support team when the user connected or disconnected to the wireless network.
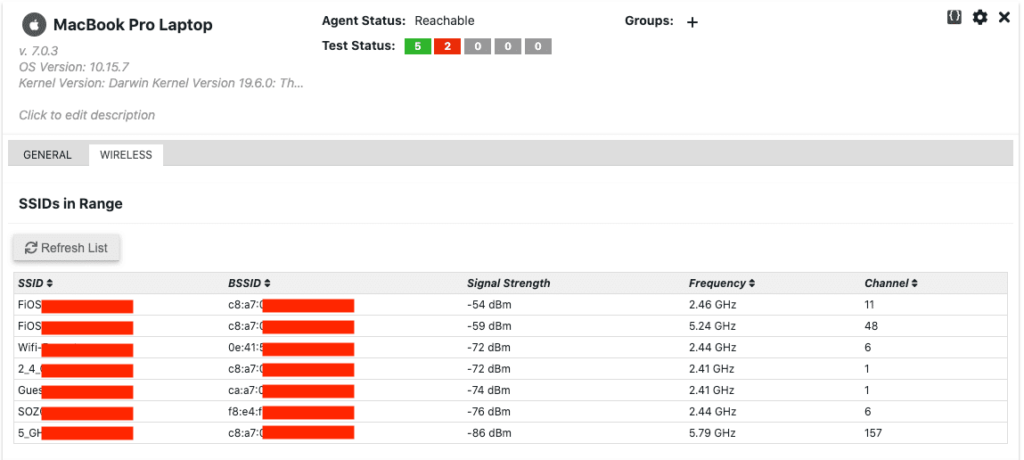
Via the NetBeez dashboard the user can also perform an SSID scan to verify if any wireless networks in proximity are using the same channel and causing performance issues to the remote user. Here’s an example of SSID scan.
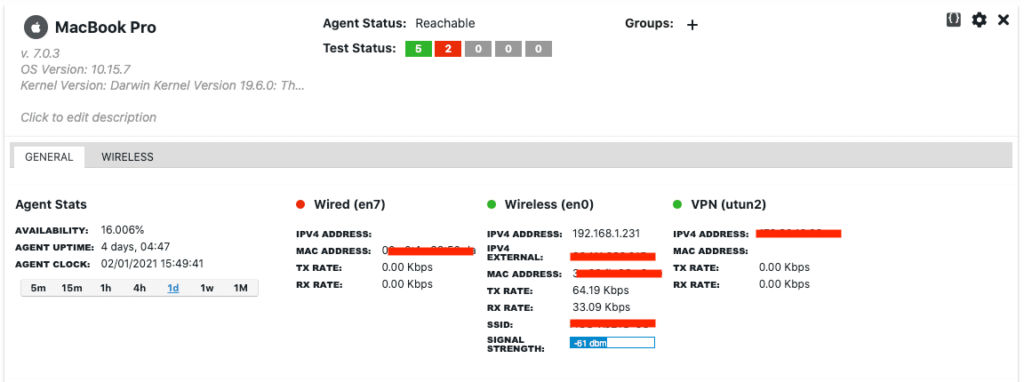
Interface status
This update also provides interface information such as connected (green dot), disconnected (red dot), link activity (Tx/Rx), MAC and IP addresses. This information can be very helpful when troubleshooting performance issues of remote users, no matter how they connect: via Ethernet, WiFi, and VPN.
Jitter and MOS estimates for ping tests
To monitor the quality of on-premises telephony services network teams periodically run synthetic VoIP calls that estimate the Mean Opinion Score (MOS). On NetBeez, this is implemented by running scheduled VoIP tests between two NetBeez agents. Unfortunately this strategy doesn’t work with cloud-based VoIP services because the network team doesn’t manage the telephony infrastructure. For this reason, they can’t deploy a network monitoring agent on the server side and monitor network performance from the user location.
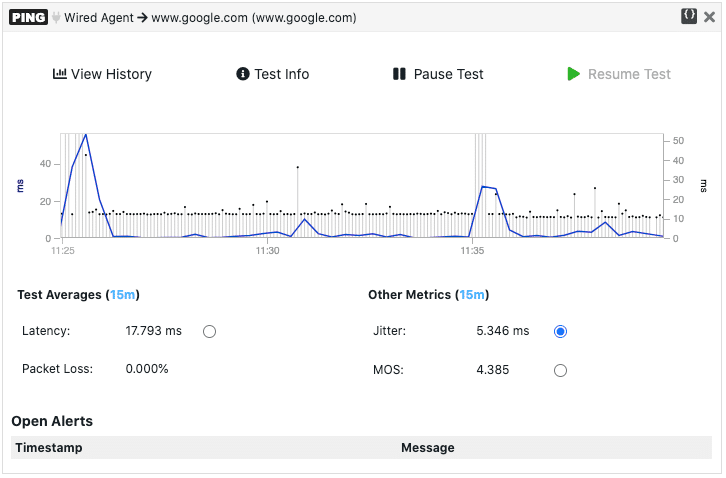
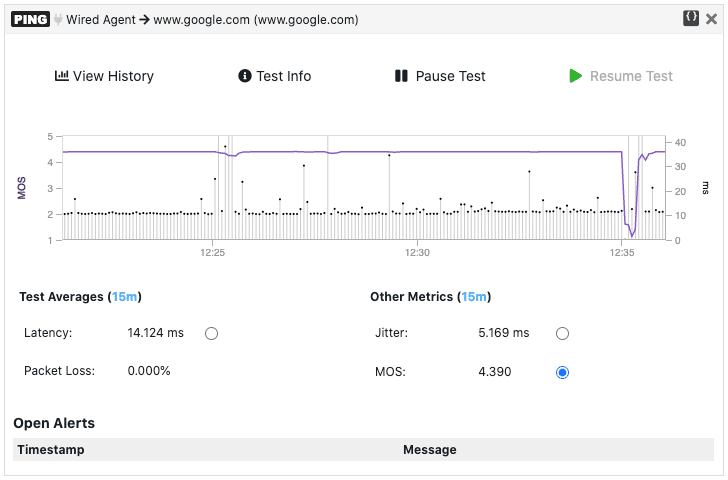
However, if we’re able to ping the servers of the cloud VoIP provider, we can at least see if network performance is causing call quality issues. Ping tests report the round-trip-time and the packet loss to a destination host. By analyzing the variance of a ping test’s round-trip time we can calculate the network jitter which, along with packet loss, is an enemy of voice and video calls. With jitter, round-trip time, and packet loss it’s possible to estimate MOS. The two charts below show the network jitter (blue) and MOS (pink) values of a ping test.
Conclusion and recorded demo
NetBeez version 7.0 is adding more capabilities that will help network teams support work from home users. The two major features that we included in this update are WiFi monitoring for Windows and Mac systems and jitter and MOS estimates for cloud VoIP monitoring. If you want to see a live demonstration, watch the work from home network monitoring demo we did at Tech Field Day.