Splunk is one of the most powerful and most prevalent platforms for machine data intelligence. Professionals in sectors such as healthcare, business analytics, financials services, security, and networking use Splunk to log, plot, and analyze data from all kinds of sources. These days, there is data coming from every direction…
At NetBeez, we are always offering more and more integration options and Splunk is one of them. In the past, we covered NetBeez integration with Slack and PagerDuty. In this post, I’ll discuss integrating Splunk and NetBeez.
Splunk comes in very handy when you’re dealing with mountains of logs and machine data from many sources. If you’re in network monitoring, you’re likely dealing with a bunch of logs from various devices and monitoring solutions. Interpreting and then acting on all this data would be pretty overwhelming without the flexible indexing and analysis powers of Splunk.
NetBeez and Splunk
NetBeez monitors network and application performance across multi-location networks with remote monitoring agents. These agents, or Beez, simulate end users by accessing resources and websites. The Beez then send in all their data about connectivity and performance and whether there are any issues. This ends up being a lot of data. While we offer an informative and intuitive dashboard for viewing that data, at some point you’ll probably want to be able to compare the NetBeez data with data from other monitoring sources, or parse and analyze it in different ways. In that case, you can take advantage of NetBeez’s Splunk integration capabilities to automatically send NetBeez data to your Splunk dashboard.
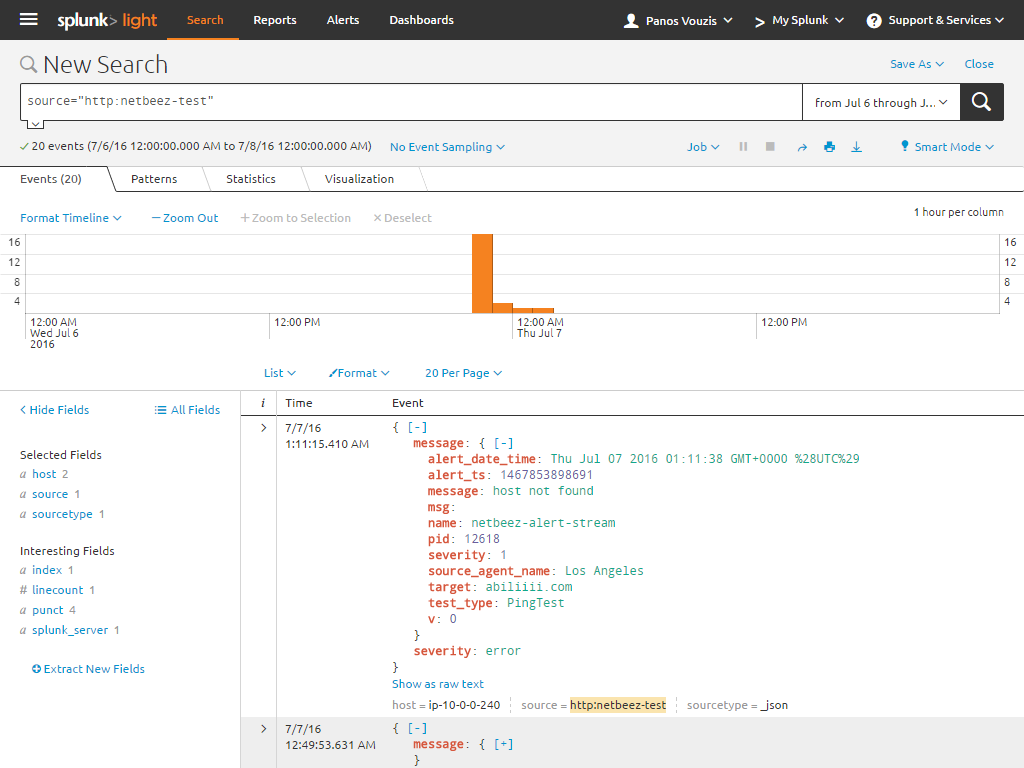
As an example, let’s say that NetBeez agents report an issue and you’re trying to figure out the scale of the problem. Is it on one location, or is it on multiple locations? You may already have a centralized monitor on your application server telling you that you application is running fine. Unfortunately though, a group of locations is reporting “Unable to resolve host”. Coincidentally, all those locations are serviced by the same ISP. So by filtering all the alerts from all locations for that application to the window of time during which you became aware of the problem, you can easily conclude that the DNS entry of your application in that ISP’s jurisdiction is problematic. At the same time, you can correlate this data with your SNMP traps to see if this is part of a larger problem and make sure that there are no additional issues. Additionally, by viewing the data over a larger window of time you may also discover if this is a chronic intermittent problem.
Conclusion
Settings up this integration is straightforward. All you need to do is set up a new data input via HTTP Event Collector and enter it into NetBeez. There are a few caveats to this straightforwardness, so be sure to read our documentation article as well as Splunk’s article on HTTP Event Collector.
Next up, I’ll be discussing integrating NetBeez with pathSolutions, so stay tuned.