Our first time exhibiting at Cisco Live was a blast! The most rewarding part was talking to hundreds of network professionals and learning about their experiences and problems, and also how we can make their lives a little bit easier with NetBeez.
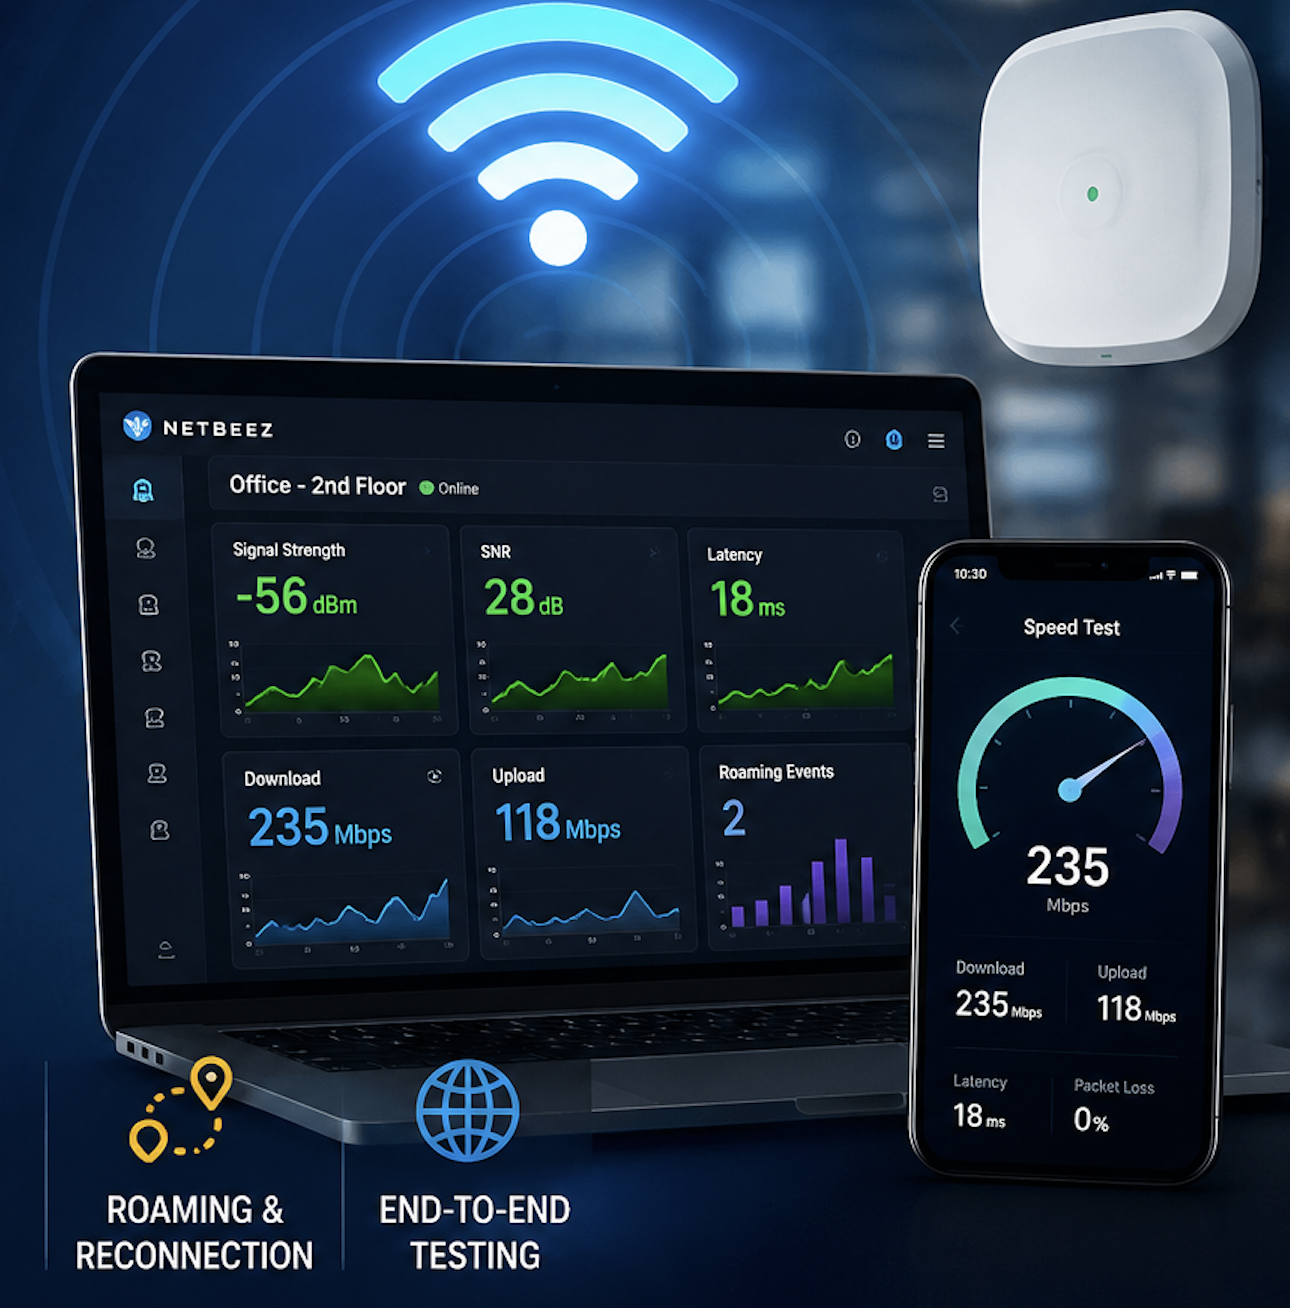
NetBeez is an end-user monitoring tool that uses WAN and WLAN sensors to capture network and application performance from multiple locations of your network. While we were at CLUS, we thought it would be an excellent opportunity to demonstrate to attendees how NetBeez network performance monitoring works and what data it collects by deploying sensors on the tradeshow floor. Here’s what we discovered:
Setup
We deployed a wired and a wireless agent on the trade show floor. A pair of agents helps in quickly identifying if the issue is the wireless or wired network causing user experience issues. The wired agent was connected to a drop in the Cisco Investments Pavilion area, and the wireless one was deployed at our booth in the World of Solutions.
User Experience Monitoring Data
Throughout the duration of the event both agents were monitoring hosts, websites, and services, such as latency, DNS resolution time, and HTTP response time to google.com, netbeez.net, ciscolive.com, and others.
Day 1
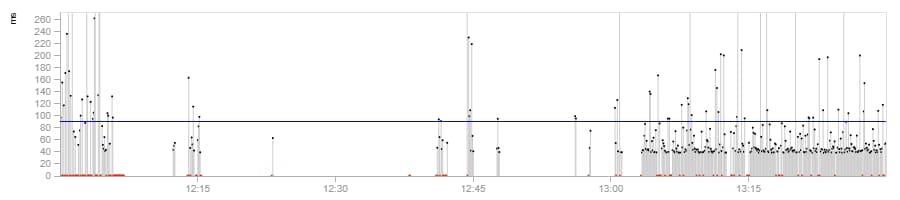
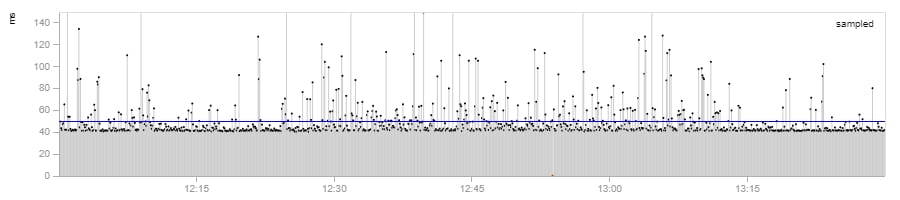
The first finding was that the WiFi on the opening day, Monday, June 26, located at the World of Solutions was showing a poor user experience on the #clus SSID. As an example, let’s look at the latency of the NetBeez WiFi agent to google.com between 12:30-1:30 p.m. that day.
And contrast the above latency data with the data from the wired agent we had on the floor:
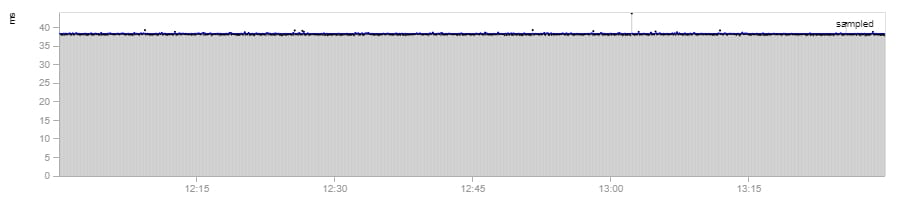
As you can see, users on the WiFi were suffering from high packet loss (red dots) high jitter, and also long and frequent disconnections from the network (gaps without data points).
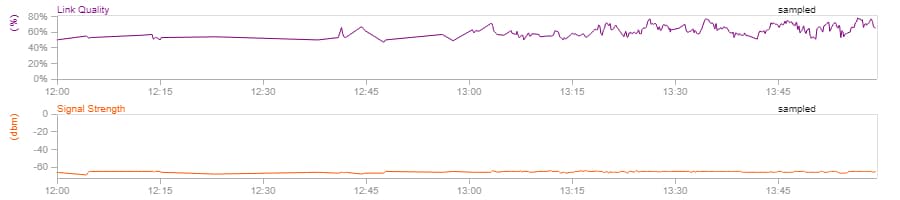
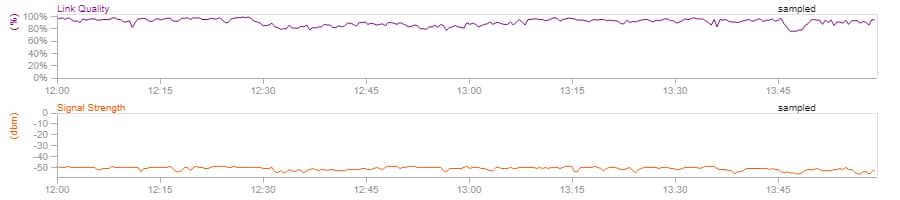
By looking at the signal strength that the NetBeez agent could pick up during the same period of time, we can see from the following plot that the signal strength was below -60 dbm while the signal quality was hovering around 60%.
We actually chatted with many of the attendees, and they confirmed that the WiFi on Monday was particularly bad.
Days 2-4
The good news is that the CLUS NOC team took action and the WiFi experience was much better for the remainder of Cisco Live as shown by data collected on Tuesday, 7/27 in the following graph.
Additionally, the signal strength and link quality was much better with values above -50 dbm and 90%, respectively.
Similar user experience problems were mitigated after the second day of the event for DNS and HTTP transactions. In the following plot we can see a summary of the Ping, DNS, and HTTP performance on the first and second day of the event (during all following days we measured similar performance).
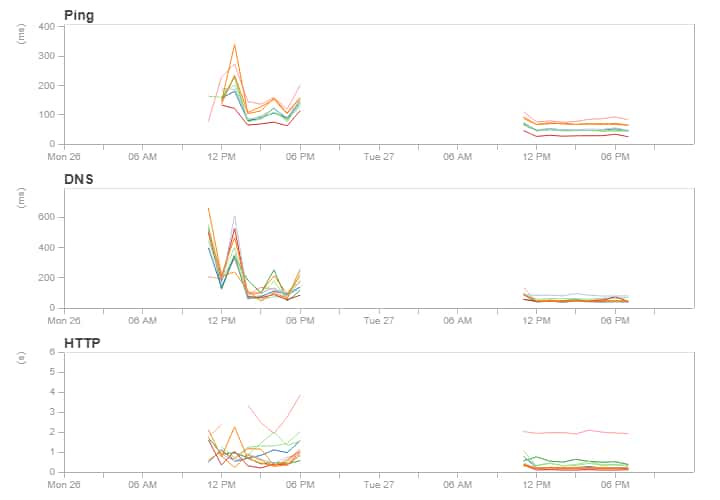
As you can see, on Tuesday the user experience was much less jittery, and more importantly, had much better response times. Performance across the board was greatly improved.
The CLUS NOC team was fast in catching these problems and fixing them on the second day. Perhaps they relied on some monitoring tool to capture this problem or maybe they received complaints by the attendees. Being very busy at the booth we didn’t notify the CLUS NOC team about this issue, but it looks like they were on top of things. To see how NetBeez can monitor your network, schedule a one-on-one demo here.