Introduction
perfSONAR (https://www.perfsonar.net/) is an open source toolkit used for running network performance tests across different network domains. The need for such a tool originated at Research and Education (R&E) institutions that everyday share large amounts of data to collaborate. In 2001, Internet2, ESnet, Indiana University, and GEANT led an international collaboration to begin the development of perfSONAR. To date, perfSONAR is not only used by R&E organizations but also by many private companies. In this short article, I will review some important components of perfSONAR and provide comparisons with NetBeez.
The Need for Speed
Due to the large amount of data exchanged every day by its users, R&E networks have high bandwidth requirements. In the following table, you can review the amount of time required to transfer a specific amount of data between two hosts:
| Data Set Size | 1 Minute | 5 Minutes | 20 Minutes | 1 Hour |
| 100 TeraByte | 13.33 Tbps | 2.67 Tbps | 666.67 Gbps | 222.22 Gbps |
| 10 TeraByte | 1.33 Tbps | 266.67 Gbps | 66.67 Gbps | 22.22 Gbps |
| 1 TeraByte | 133.33 Gbps | 26.67 Gbps | 6.67 Gbps | 2.22 Gbps |
| 100 GigaByte | 13.33 Gbps | 2.67 Gbps | 666.67 Mbps | 222.22 Mbps |
| 10 GigaByte | 1.33 Gbps | 266.67 Mbps | 66.67 Mbps | 22.22 Mbps |
| 1 GigaByte | 133.33 Mbps | 26.67 Mbps | 6.67 Mbps | 2.22 Mbps |
| 100 MegaByte | 13.33 Mbps | 2.67 Mbps | 0.67 Mbps | 0.22 Mbps |
Table 1 – Time to transfer x bytes in y time (source http://fasterdata.es.net/home/requirements-and-expectations).
The goal of perfSONAR is to spot and address any end-to-end network performance issues that limit bandwidth transfers between two geographically separate networks; these network performance issues could have a negative impact on the work of researchers, professors, and students. In fact, “the global Research & Education network ecosystem is comprised of hundreds of international, national, regional and local-scale resources – each independently owned and operated. This complex, heterogeneous set of networks must operate seamlessly from “end to end” to support science and research collaborations that are distributed globally.” (Source perfSONAR Overview)
Before perfsonar
However, before perfSONAR, network engineers could only rely on tools that would detect hard failures occurring within an individual network. There were no tools available that would detect soft failures occurring between networks. So what’s the difference between a hard and a soft failure?
A hard failure is caused, for example, by a fiber cut, power loss, or a router that stops functioning. This type of failure is relatively simple to detect with an SNMP-based network monitoring tool. On the other side, a soft failure that is caused, for example, by overloaded resources, like an oversubscribed switch or firewall, is difficult to detect with passive or SNMP-based tools. To detect such issues, it is necessary to implement continuous throughput and latency tests to validate, end-to-end, the overall network.
Network Performance Tests
A perfSONAR server is used to verify four important key parameters of network performance: TCP throughput, one-way delay, packet loss, and traceroute. These values are collected by running the following network performance tests:
- Iperf and nuttcp to estimate TCP throughput
- Ping and owamp to measure latency and packet loss
- Traceroute, tracepath, and paris-traceroute for routing information
Most of these tools are available via the command line interface of Linux or other *nix-like hosts (e.g. Mac OS X); many are used every day by network engineers to troubleshoot network and application performance issues.
However, command line utilities were meant to be run ad-hoc, as a diagnostic procedure after a problem occurs and not in “background mode” to monitor a network. The benefit of having a system like perfSONAR that runs tests continuously and then stores test results, is the ability to build a network performance baseline, and then compare it with real-time data to proactively detect end-to-end performance issues.
Architecture Overview
The perfSONAR architecture is organized in layers, in which each layer is responsible for a specific function. In the following image, you can review a graphical representation of the perfSONAR architecture:
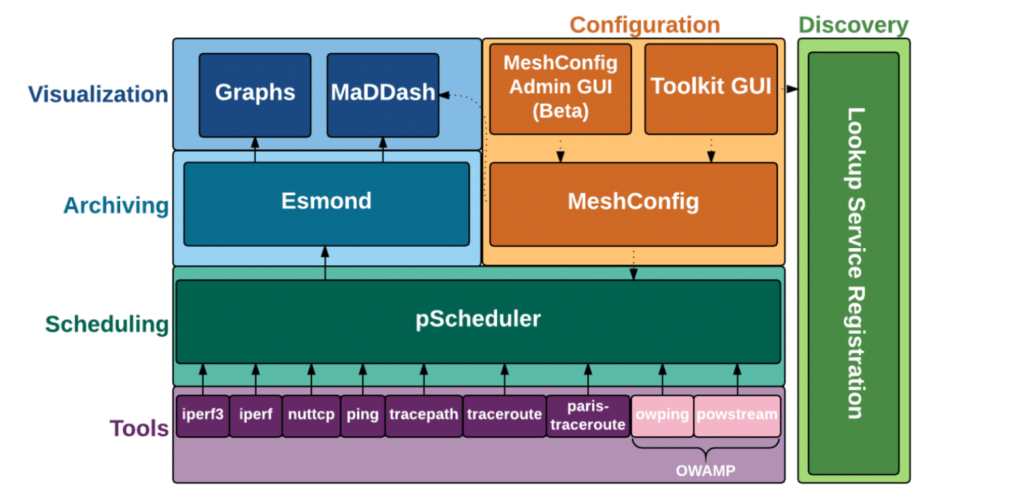
Figure 1 – Overview of the perfSONAR 4.0 architecture.
Perfsonar components
Let’s review each layer, starting from bottom to the top.
Tools
This layer includes all of the network performance measurement commands (ping, iperf, tracepath, …) that the perfSONAR server runs. Many tests that you find here, such as ping, traceroute, and iperf, are also available in NetBeez’ dashboard.
pScheduler
This layer was introduced in version 4.0 of perfSONAR, and, as the name implies, is the scheduler responsible for scheduling tasks and storing results. The purpose of the pScheduler is to create a wrapper around the commands or tasks performed by perfSONAR. For example, if the user wants to run an iperf test, the command will be run as pscheduler task throughput or if the user wants to run a ping test, it will invoke the pscheduler task rtt command.
Archiving
Esmond is the software module responsible for archiving measurements. This layer has a Restful API and follows a hybrid model for storing data. Time-series data, such as interface counters, is stored using Cassandra and displayed using RRD. Metadata (such as interface description and interface types from SNMP) are stored in an SQL database.
Visualization
MaDDash is the dashboard used to visualize the test results in a two-dimensional grid, something very similar to NetBeez’ grid view.
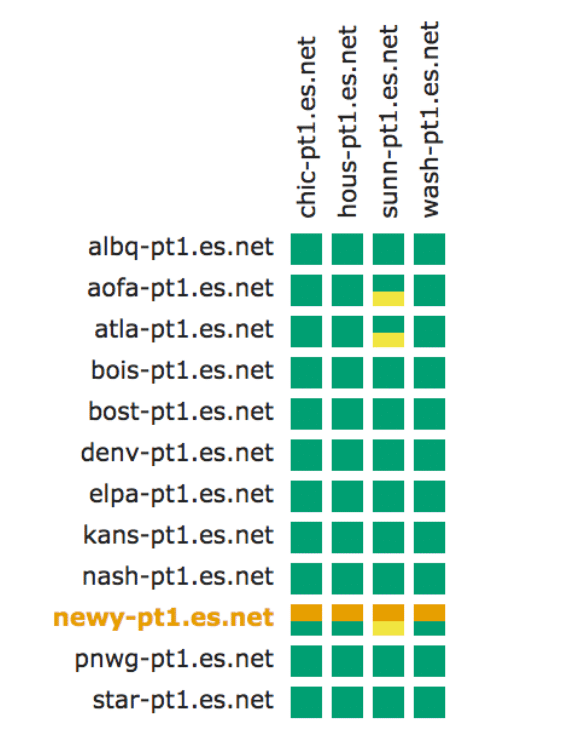
Figure 2 – Screenshot of a MaDDash’s grid view.
Configuration
MeshConfig is used to simplify the configuration and update of tests running on multiple perfSONAR hosts.
Discovery
The Discovery service (also called Lookup Service Registration) is used by hosts to build a dynamic list of hosts that can be used as testing endpoints.
The installation procedure of a perfSONAR host is pretty simple – according to the documentation, takes less 30 minutes! The service can run on a virtual machine, or on a dedicated hardware. If you are interested in running it on a small, low-cost hardware option, consider the usual Raspberry Pi or Intel NUC for instance.
Adoption and Public Deployments
Since its launch, the perfSONAR community has been growing steadily. To date, many research institutions are using perfSONAR to monitor the performance of their network. ESnet has published on its website a list of public perfSONAR servers that the community can use to run end-to-end tests. If I recall correctly, hosts that are listed on this page are registered via the Lookup Service Registration that I cited earlier in the Architecture Overview section of this post.
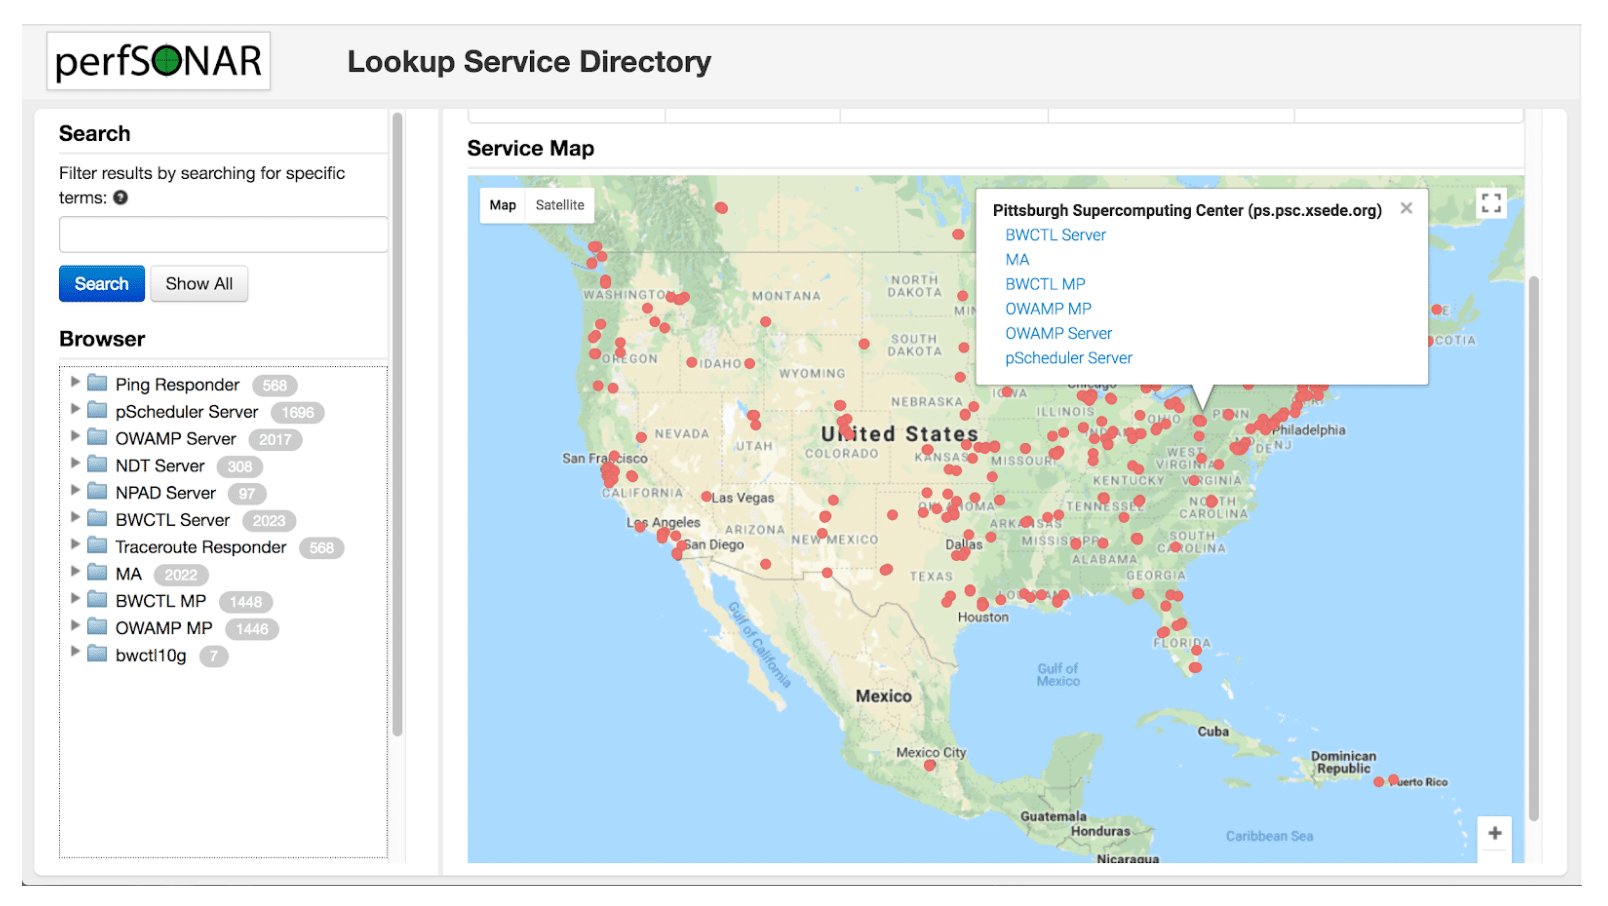
Figure 3 – Pubilic perfSONAR servers location page (source https://stats.es.net/ServicesDirectory/).
The online Lookup Service Directory can be very useful to troubleshoot ongoing performance issues between two networks. As shown in the above screenshot, as of May the 13th 2018, there are more than 2,000 public perfSONAR hosts; I am sure that the number of private ones is even higher. If you are a perfSONAR user, it would be great to get your feedback in the comments section about how you have deployed this platform and, if you are also a NetBeez user, how it compares to NetBeez.


