You can monitor your network with SNMP to gather bytes in and out your routers and switches’ interfaces, or check periodically the CPU and memory utilization. This information is fundamental in making sure that your network equipment’s resources are not oversubscribed and subsequently cause performance issues for the applications.
You can use NetFlow, SPAN ports, or TAPs to get accounting information on user traffic traversing the interfaces of your routers and switches. Flow data is very important in finding out what protocols, applications and users are most heavily utilizing your network or draining your bandwidth and set a baseline of average network utilization.
You can say, “Super, that’s great! I have what it takes to be a network Jedi and quickly detect issues, identify their root cause(s), and fix them!” “Not so fast, young padawan…” I am sorry to tell you that, unfortunately, there is something else you are missing in your network monitoring arsenal. And that is active monitoring.
(If you want a better overview of SNMP based, flow data, and active monitoring, I encourage you to read this other blog post about each level of monitoring)
Active monitoring enables the network engineer to monitor parameters like network latency, packet loss, application response time, and bandwidth available to the individual user. Like SNMP and flow data, active tests are extremely useful in proactively detecting problems that do or will affect the end users (e.g. increasing packet loss or application response time).
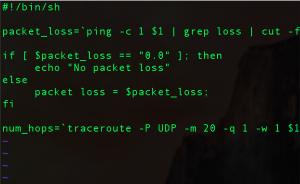
So what is the primary tool available to the network engineer who wants to start doing active monitoring in her network? Scripts, of course! I am sure that you have probably written one or more scripts that test for network connectivity, file transfer, etc. Scripts are great (especially Bash or Python scripts).
Here, I would like to list the top three commands that engineers use in their scripts:
PING
Ping is the command to measure round-trip time from the local workstation to a remote IPv4 host. Ping uses ICMP echo-request/echo-reply messages. You can also use Ping to estimate Maximum Transmission Unit (MTU), associated packet loss, and compare these metrics to different Type-of-Service classes.
Traceroute
Traceroute is the go-to tool for quickly identifing the number of hops between the running workstation and any IPv4 host. With traceroute, you can obtain measurements like RTT to each individual hop, hop IP address, and DNS reverse lookup. Traceroute can use ICMP, UDP, and TCP as its protocol and relies on the ICMP Time Exceeded message from routers.
File transfer
Running scripts to fetch a file from an FTP or HTTP server and then record the time to download could be a good way to assess bandwidth available to an individual user. Commands like curl or wget can easily do the trick. You can also use the TCPI/IP swiss army knife, netcat. You can visit the Sourceforge project page here: http://nc110.sourceforge.net/. Another well-known tool widely used by the community is iperf. Iperf allows you to measure bandwidth, data jitter, and packet loss between two workstations. The only requirement is that both endpoints have the iperf package installed.
To conclude, active monitoring is very important to network engineers. Active monitoring is also necessary to establish a baseline and understand average network latency, packet loss, application response time and so on. Scripts are a good start to do this, but require considerable expertise and time to implement across dozens or hundreds of network locations. However, scripting is darn fun and I believe a good engineer should have a good level of proficiency with Bash, Perl, or Python scripting.
I am sure that you already know that NetBeez is capable of running active tests like PING, DNS, HTTP, Traceroute and Iperf at scale. If you are ready for the next level of active monitoring (scripts on steroids) and would like to count on automation, ease of use, and advanced reports, I encourage you to request a NetBeez demo.