SIGGRAPH 2017
The SIGGRAPH 2017 conference was held this August in Los Angeles, showcasing the latest in computer graphics and interactive techniques. Over 16,500 attendees from around the world came to the annual interdisciplinary, educational experience that includes papers, courses, lectures, panels, interactive installations, artworks, and an exhibition. This variety of content, contributors, volunteers, and staff requires a stable and performant network for the duration of the conference.
The volunteer SIGGRAPH GraphicsNet team plans, deploys, and supports a conference network that is reliable, efficient, and fulfils the conference’s diverse network requirements. They coordinate and negotiate with the convention center networking provider to maximize value for the conference while ensuring staff, contributor, and attendee satisfaction with network availability and performance. The goal is not necessarily to create a state-of-the-art network; rather, to facilitate a state-of-the-art conference experience.
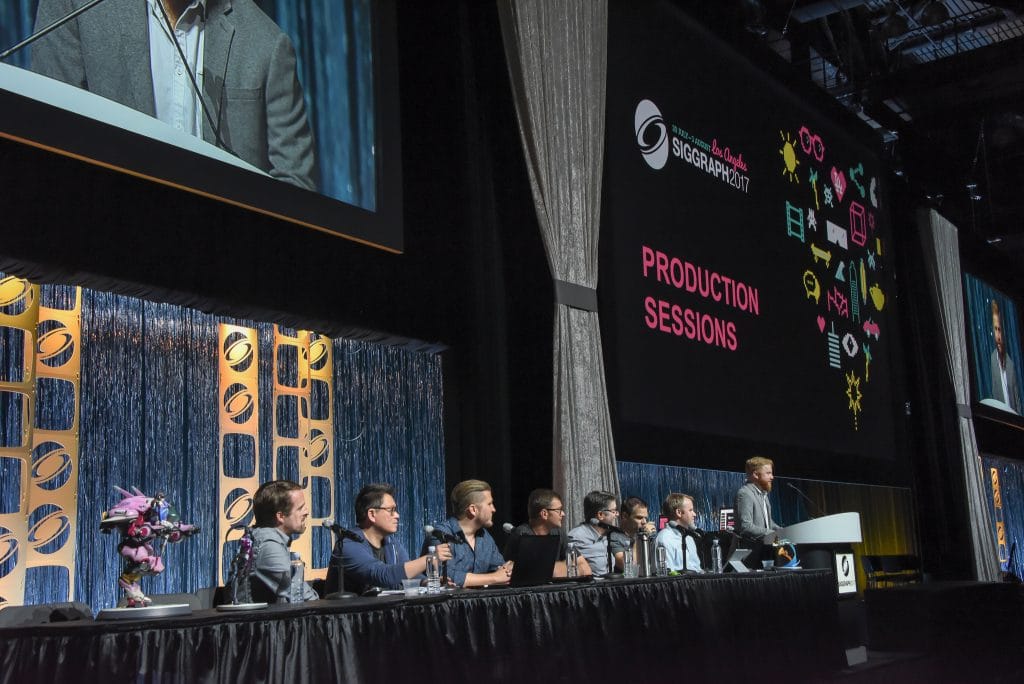
Photo credit: blog.siggraph.org
Monitoring and troubleshooting the temporary conference network involves a variety of hardware and software tools. Enterprise infrastructure management software, used by the convention center networking provider for their services, can provide a high-level summary. However, visibility typically stops at the wall, which is where custom deployment begins. Since there often isn’t direct access to the wireless controllers used by the convention center, detailed wireless network statistics are either unavailable or must be manually requested. SNMP access to the GraphicsNet switches and access points can certainly be helpful, but doesn’t always illuminate the real end-user experience. Therefore, when troubleshooting, it’s still useful to be in the field with laptops and handheld network testing devices.
Network Monitoring of GraphicsNet
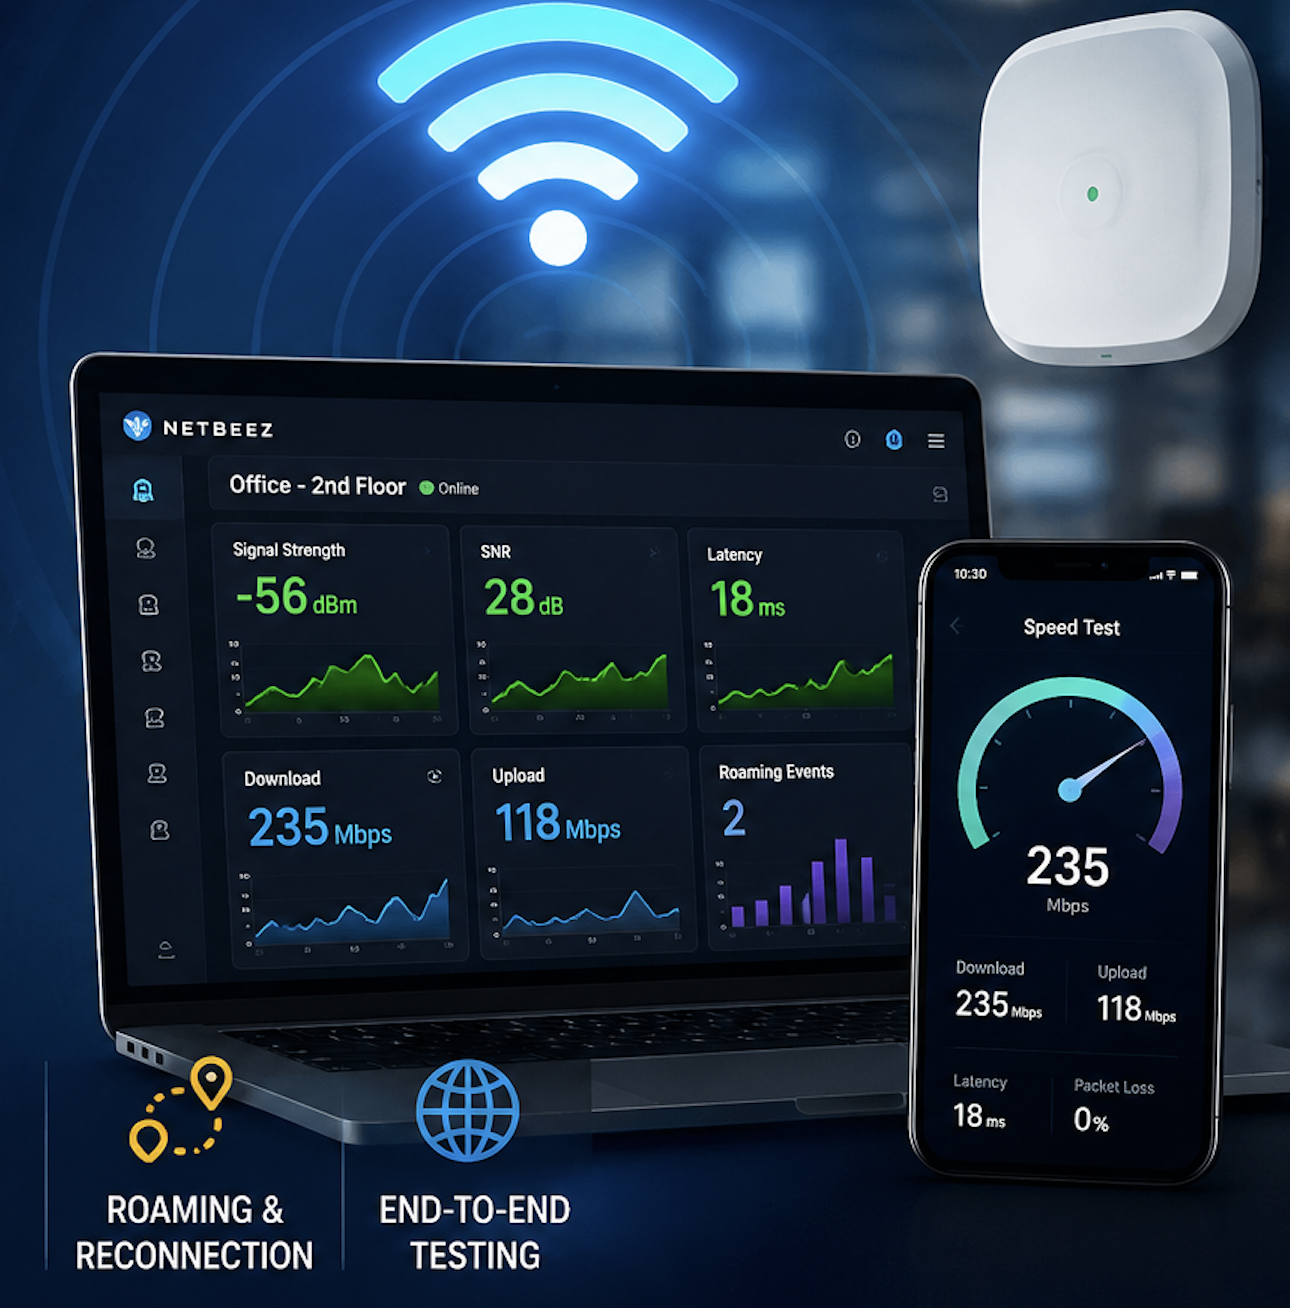
GraphicsNet had prototyped its own end-user monitoring tools using Raspberry Pis, Ansible, Sensu, InfluxDB, and Grafana in 2016 with good results. Collecting information on wired and wireless network conditions from multiple devices physically distributed through the convention center was valuable in several situations. From a reassuring finger on the pulse of the network to SSHing directly into a remote Raspberry Pi when troubleshooting, this approach alerts GraphicsNet volunteers about network degradation as soon as users might begin to notice and quickly identifies whether problems are localized or systemic. When GraphicsNet began looking to expand the number of Raspberry Pis and features of the system for 2017, they were delighted to discover NetBeez and their more powerful, polished end-user network monitoring solution.
NetBeez immediately understood the needs and workflow, having themselves monitored other large conference networks. NetBeez generously donated the use of their software during the conference as well as additional Raspberry Pis, and also provided valuable advice on how to easily integrate their system into GraphicsNet deployment and monitoring. Since SIGGRAPH is a non-profit 501(c)3 organization, run by volunteers, GraphicsNet was very grateful for the support in delivering a smooth and successful conference network implementation.
NetBeez Deployment at SIGGRAPH
GraphicsNet deployed a total of 33 hardware agents – 18 wired and 15 wireless. This provided good coverage of critical conference areas without adding too much additional deployment work for a relatively small team. Each agent required a Micro SD prepared with GraphicsNet’s account’s custom image, which required some additional preparation time. GraphicsNet selected both internal and external test targets and found the default tests to be sane and useful. Speed tests from the agents, even with FastEthernet interfaces on the Raspberry Pis, were useful in sanity checking Internet bandwidth usage and limits. When coordinating with the convention center’s networking provider, GraphicsNet was able to quickly provide quantitative reports of observed network conditions for the areas in question and in comparison to unaffected areas. As performance for end-users degraded slightly near dense wireless usage, as expected, the GraphicsNet team was able to confidently say that latency and rates were still within acceptable tolerances. In general, the NetBeez dashboard and Slack integration provided constant feedback on network conditions during setup and throughout the conference.
Conclusion
GraphicsNet was both fortunate and grateful to experience only minor, quickly resolvable issues during the conference, but felt more prepared and proactive when issues did arise. Network degradation under load can often be the smoke before the fire of outright user connectivity issues. Having a sense of the type and scope of a potential problem before an alert was triggered (or the phone rang) allowed GraphicsNet to provide better feedback to users as they worked to narrow and resolve the situation. GraphicsNet believes that the conference network, which exists for a short period of time but aspires to high reliability and consistency, greatly benefited from actively measuring the end-user experience.