I am happy to announce that NetBeez version 12.0 is now generally available to all NetBeez users. In this new release, you can find the following major updates:
- New target report
- New scheduled test report
- Support for SAML SSO enterprise authentication
- Role-based access for agent interactive console
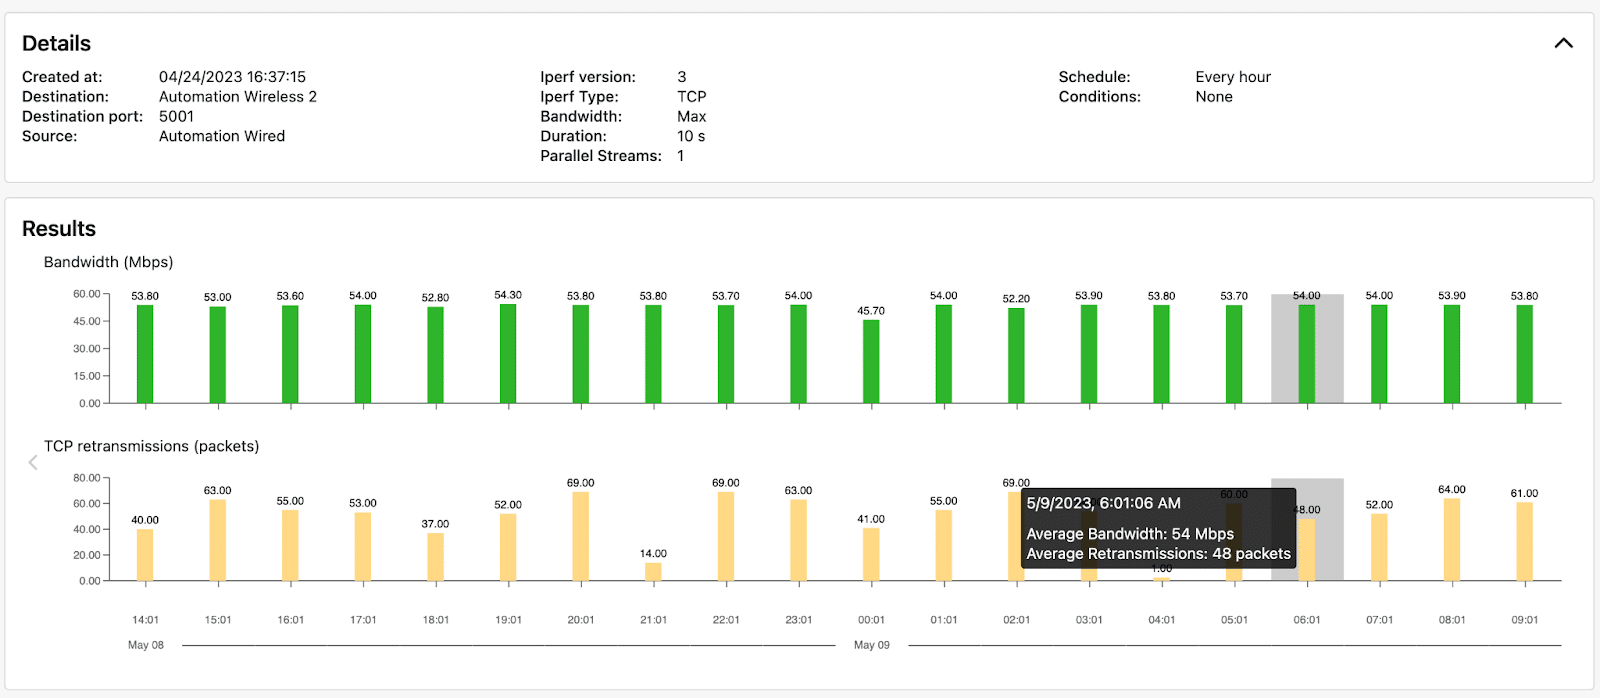
- iPerf TCP tests (version 3) report retransmissions
- New incidents API
For the full list of improvements and bug fixes, please read the 12.0 Release notes available on our online documentation. Users that wish to learn more about these features, have questions, or want to share their feedback can do so the 12.0 release announcement post included in our community.
The New Reports
With this release we complete the redesign of all four available NetBeez reports. Just as a refresher, the four available reports in NetBeez are, at the moment:
- Network summary – This report provides a high-level overview of the agents deployed and the targets configured for monitoring.
- Agents – A detailed report about the performance of all the targets’ tests run by one agent, including the incidents and the alerts triggered.
- Targets – A detailed report about the performance of the tests included in a target, including the incidents and alerts triggered, broken down by agents.
- Scheduled tests – A detailed report about the performance of one or more scheduled tests.
The first two reports were updated in earlier releases. The Reports tab of NetBeez dashboards now groups the new reports under the New subtab. The legacy reports are located under the Legacy subtab. This organization will be in effect only for 12.0. In 13.0 we are planning to complete the migration to the new reports format by giving users the ability to share them via email or public links. At the moment, this function is only available for legacy reports (less the public link). Once we complete the implementation of the new reports functionality, including scheduled email reports, we will be phasing out the Legacy Reports with the release of version 14.0. This will provide enough time for all the users to transition to the new reports.
New Target Report
The new and redesigned target report includes all the metrics and graphs available in the legacy report plus visual enhancements to handle a larger set of agents. Since the line graphs become hard to read when the number of agents is higher than 10, we decided to replace them with histograms that show the performance distribution of the agent averages per test type.
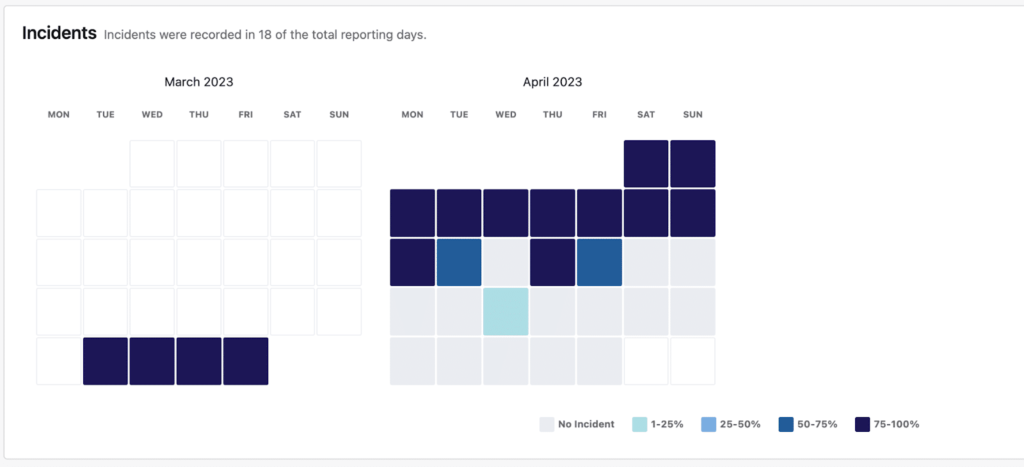
The first section of the report provides an overview of the incidents that occurred during the report period. This section helps identify what time periods had higher occurrence of issues with the target in question.
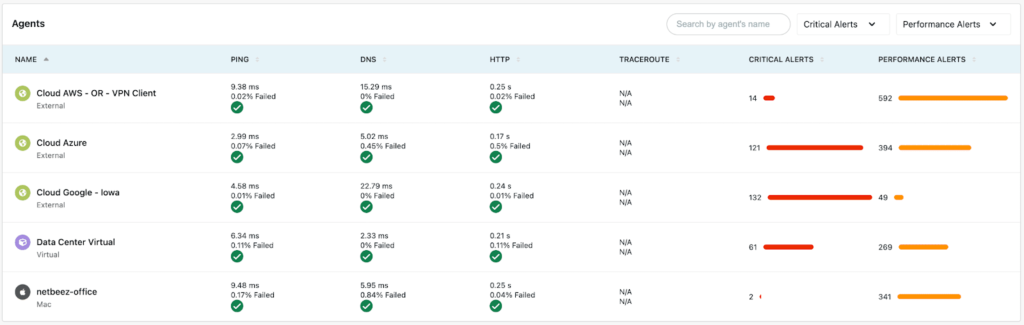
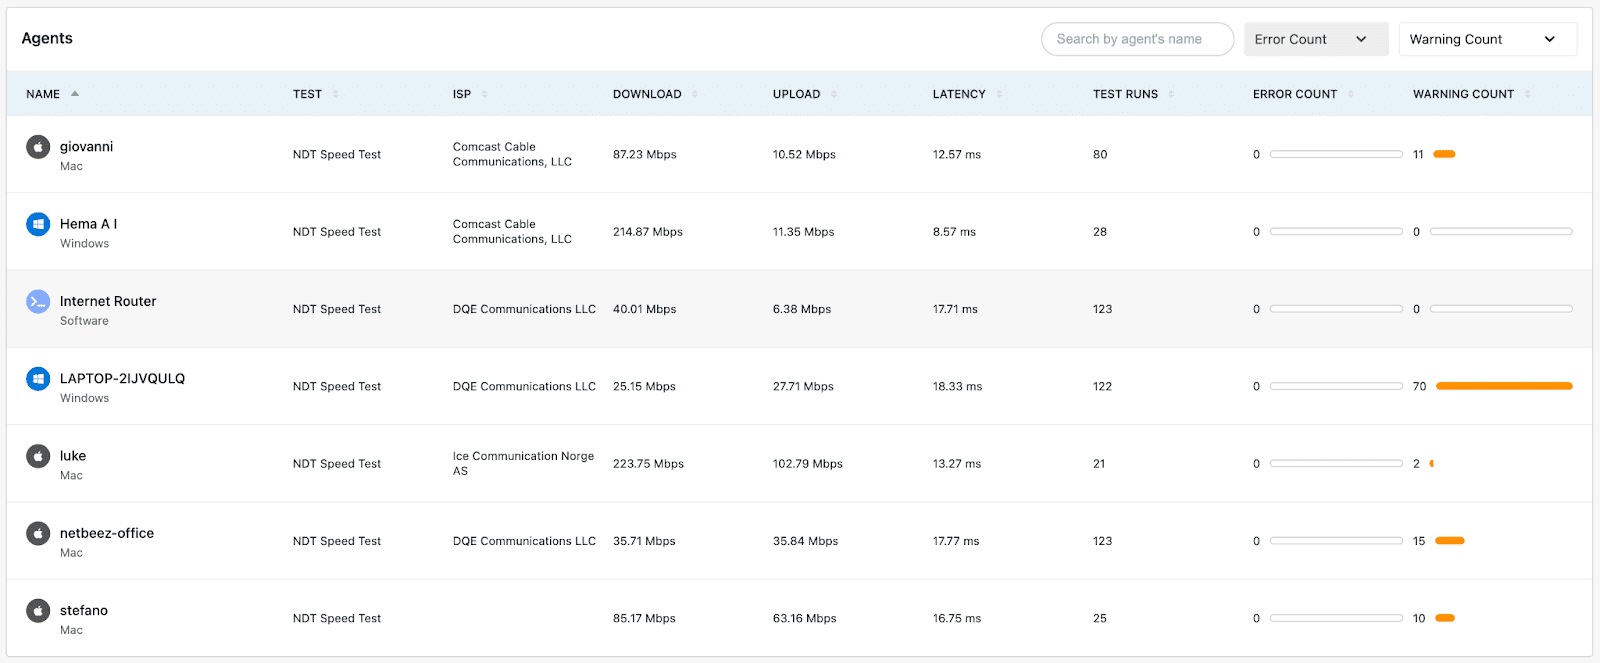
In the following table the report displays the performance of each monitoring agent included in the target. For each agent entry, the report provides a summary of the average test performance, failure rate, and occurrence of critical (up-down) and performance alerts.
In the succeeding section, the aggregate performance data from all monitoring agents are organized in a histogram chart. This is a good way to identify good and bad performance within the set of agents deployed for monitoring the target.
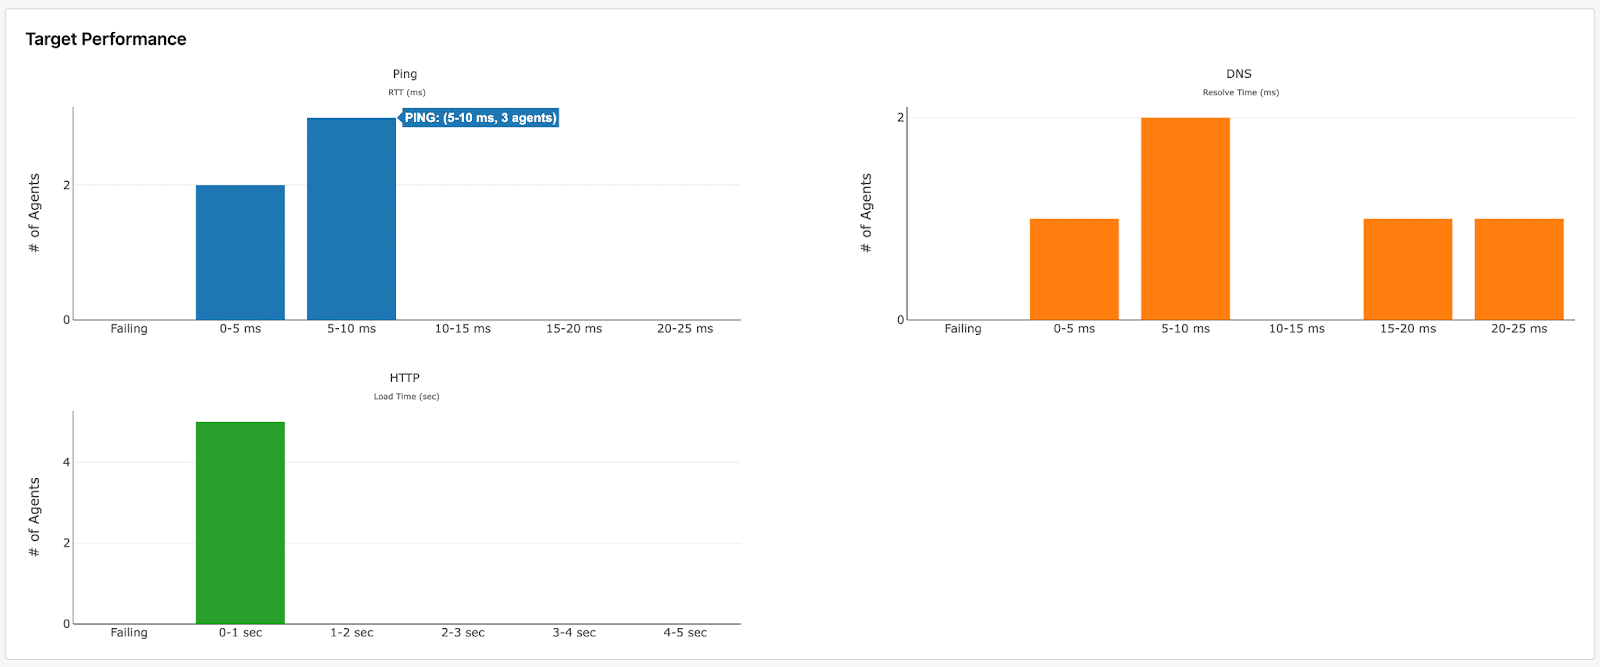
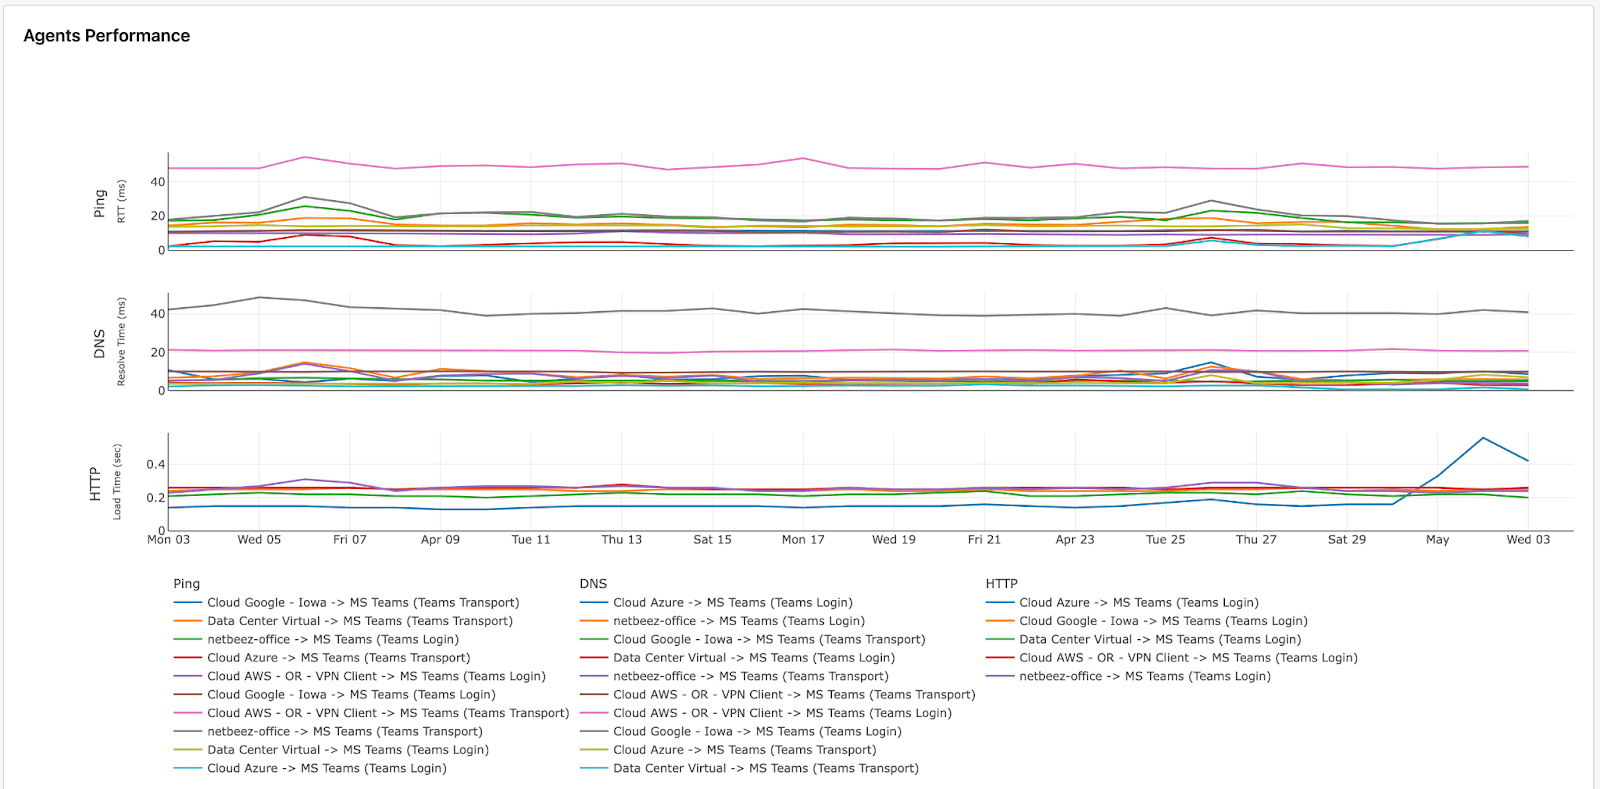
In the last section, the target report plots the trendlines of the performance tests run by agents against the target. This chart provides a better understanding of performance changes during the time period analyzed.
New Scheduled Tests Report
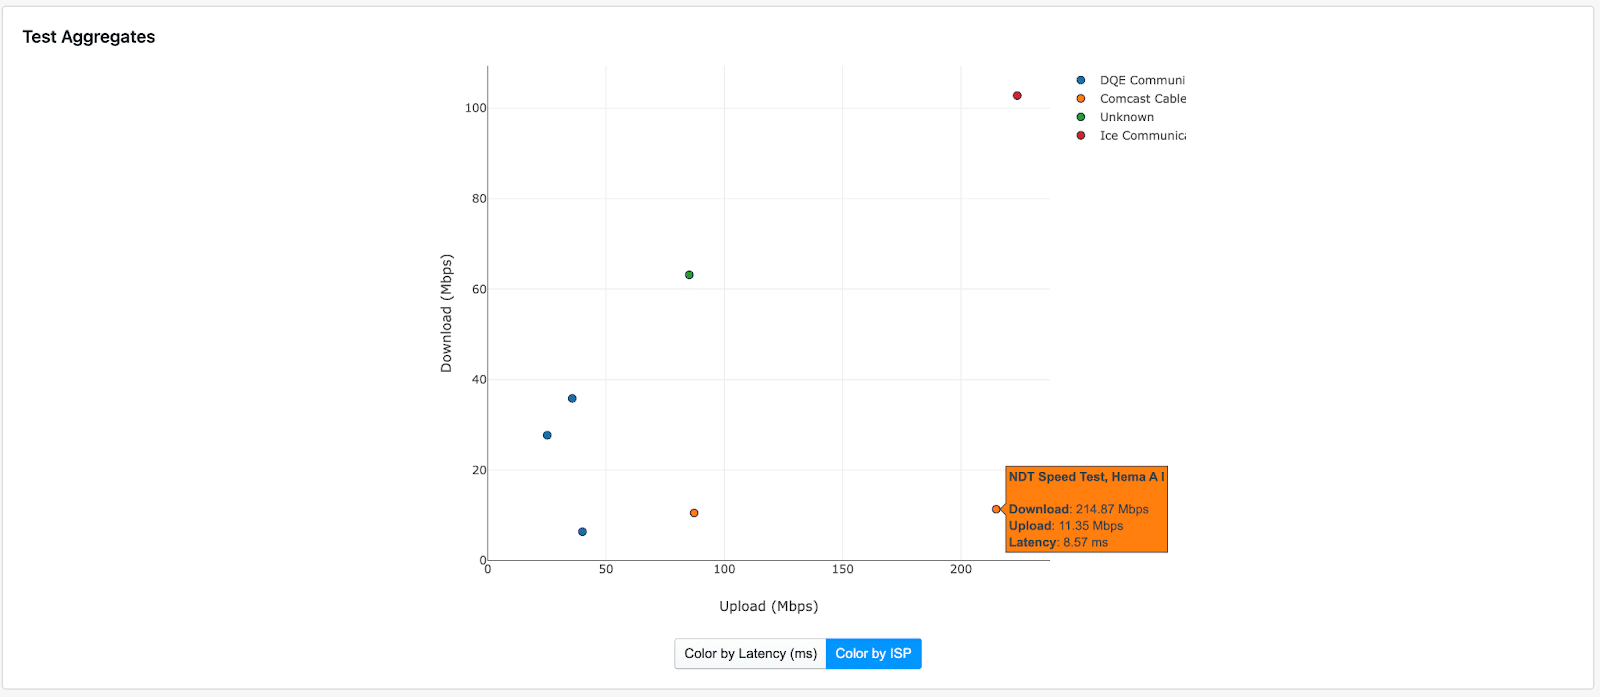
The redesigned scheduled test report includes all the metrics and graphs from the legacy report, with the added ability to scale when results include more than 20 agents. This is particularly valuable when assigning a network speed test to a high number of remote workers agents. With the new scheduled test report, you can gather insights into the ISP performance of your end-users by inspecting the scatter plot that reports the download, upload, and latency averages of each agent over the selected time period. The following screenshot shows the download/upload scatter plot where the third dimension is the ISP name.
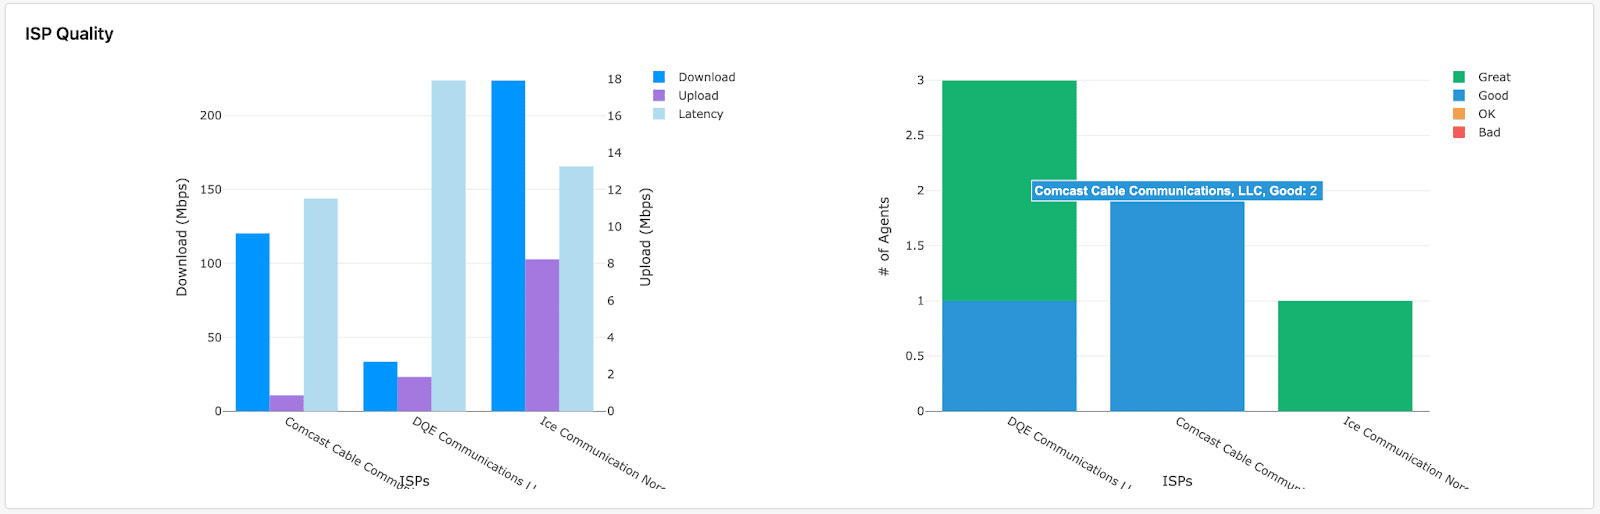
The network speed test report also includes two histograms showing the average performance of agents. The goal of this visualization is to understand and correlate user issues with specific ISPs. On the first one (screenshot below, left side), the agents are aggregated on a per ISP basis and the two y axes report download and upload speed. On the second one (screenshot below, on the right side), the agents are aggregated on a per ISP basis and the y axis reports the quality of the ISP connection (great, good, OK, and bad). The ISP quality index is calculated based on download and upload speeds.
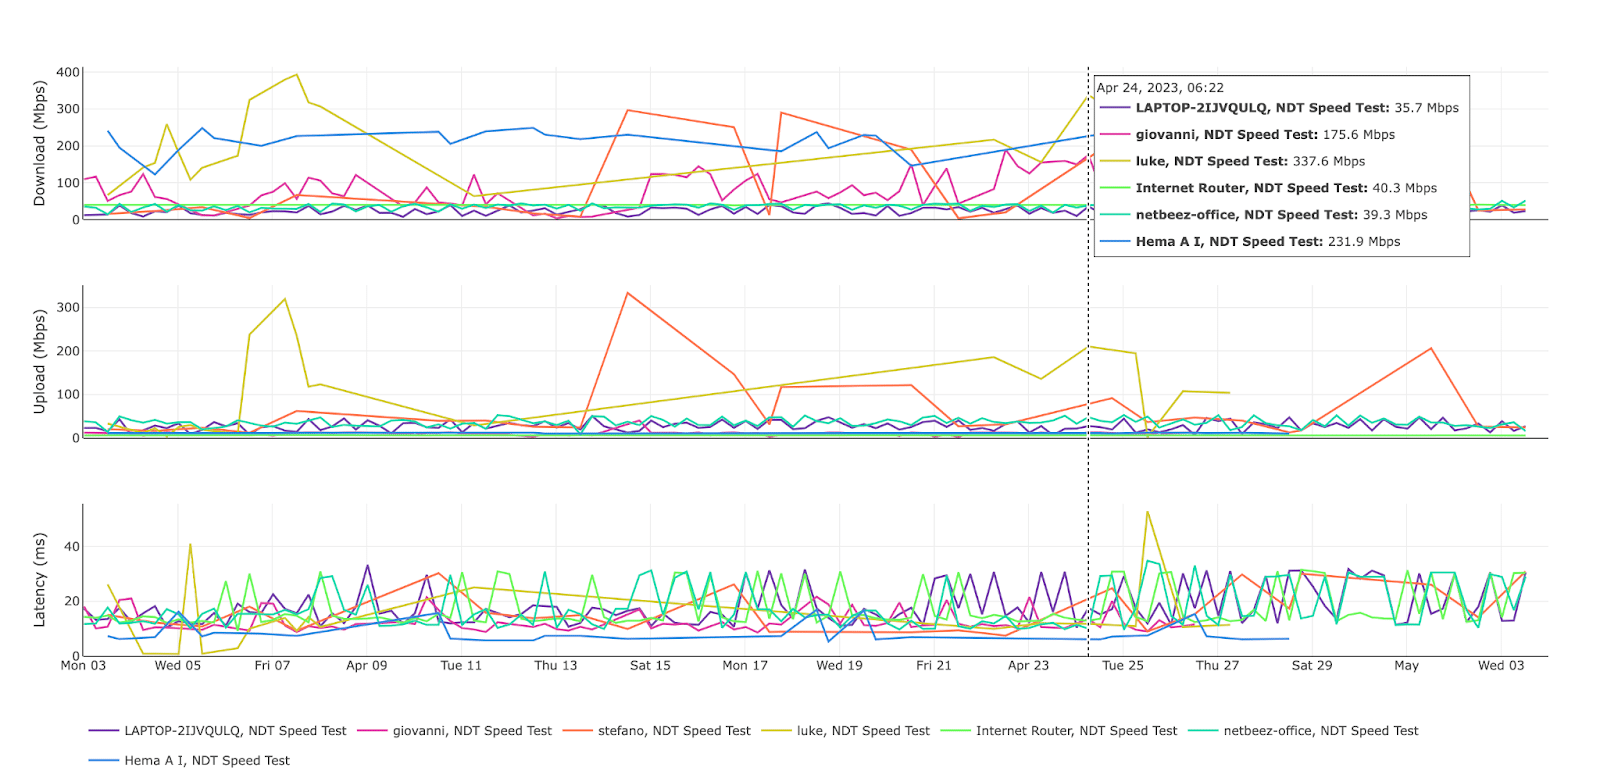
As in the legacy format, the scheduled test reports include trendlines of the test results as well as summary tables with the average of the results for the time period considered.
Other Features Included in 12.0
SAML SSO Enterprise Authentication
In an effort to expand the range of integrations available in NetBeez, SAML SSO is now available as an enterprise authentication method. This option, in addition to the already existing available simple LDAP and Azure AD, allows users to securely authenticate their accounts using their established enterprise credentials, providing an extra layer of security and convenience. SAML is a method that facilitates integration with Okta authentication.
iPerf tests now show TCP retransmissions metric
TCP retransmission (or retries) is a performance metric that is reported when the user runs a TCP test with iperf version 3. This metric returns the number of datagrams that are lost in transmission. In 12.0 the NetBeez dashboard now reports this metric for all TCP iperf version 3 tests.
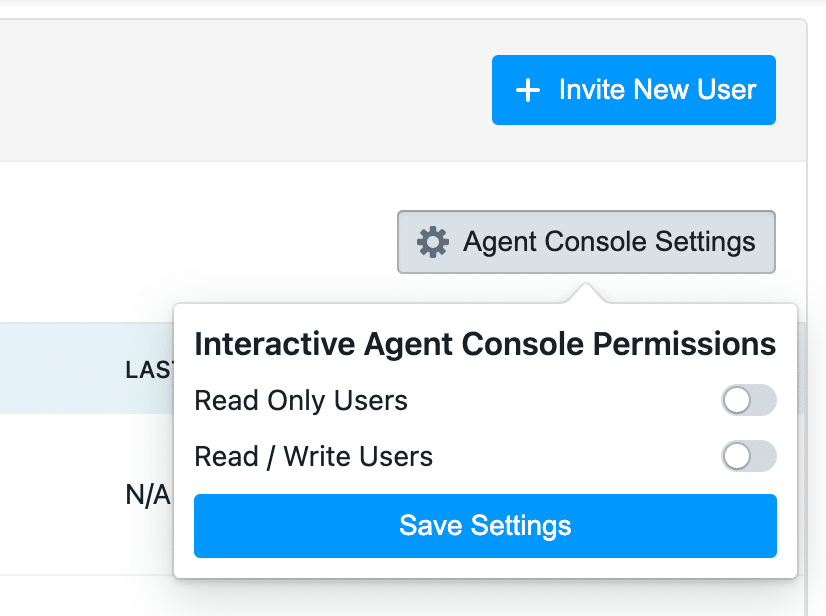
Role-based access for Agent Interactive Console
We have added role-based access to the network agents’ interactive console. This new setting lets the dashboard administrators decide if users that belong to the read-write and/or read-only groups should have access to the console. This feature provides greater control over the way that users interact with the platform, allowing unprivileged users to also access this capability.
Incidents API
Thanks to the new incidents API, which enables users to programmatically access and manage network incidents, such as outages or performance issues. This API provides developers with greater flexibility and control over the way incidents are handled.
Conclusion
12.0 provides several updates such as new reports, support for SAML SSO enterprise authentication, and iPerf TCP tests. The new reports include a target report and a scheduled test report, both redesigned to provide better visualization of the data. Other updates include role-based access for agent interactive console and a new incidents API. Detailed descriptions of the new features can be found in the 12.0 Release notes on the NetBeez website.
If you wish to review the previous releases updates, check out the release 11.1 post.