There are a few open-source and free tools out there that can help visualize the path traversed between two hosts. We’ve talked about mtr in a previous post, and then also traceroute. Recently, I came across a new solution for path analysis called Dublin traceroute.
Actually, the inventor of Dublin traceroute maintains his own blog here, and there you can find many more details about the tool, how to install it and how to use it than this post. However, I wanted to make a summary of the tool’s capabilities, how it is different to other tools and how it can be used.
ECMP
Traceroute displays the route and delays for each packet hop between two hosts. On top of traceroute, mtr provides packet loss and jitter for each hop. Both traceroute and mtr show and analyze just one path, and actually, due to their limitations, they may even show wrong or even impossible paths.
These drawbacks are caused by Equal-Cost Multi-Path (ECMP) routes which are pretty much expected when traversing the public internet. ECMP is not as common on WANs. The first open-source tool to have solved this problem was Paris traceroute.
Dublin traceroute uses the same techniques as Paris traceroute, and in addition introduces new techniques for NAT detection that improve the reported result accuracy. To put it into the author’s words:
“Paris-traceroute can tell you whether a hop that appears as a loop in a traceroute is due to NAT, while Dublin Traceroute can tell you whether there is a NAT after a given point, and can also identify multiple NATs. At the best of my knowledge, there is no tool nor public research using this technique. If I am wrong, please let me know so that I can give the credit where due.”
And
“When you run a regular traceroute or paris-traceroute through this kind of (missconfigured) NAT, you will see no response from all the hops located just after these broken NAT boxes.”
Examples
Although Dublin traceroute might be available on standard repositories, I would advise that you install its latest version either from source or from the testing repository.
You can run a test as follows:
sudo dublin-traceroute google.com -o google.json
I almost always use the -o flag to redirect the JSON output of the results to a file. If you don’t, you will get a very long output that you probably can’t read. The regular output looks like this:
dublin-traceroute 8.8.8.8
Starting dublin-traceroute
Traceroute from 0.0.0.0:12345 to 8.8.8.8:33434~33453 (probing 20 paths, min TTL is 1, max TTL is 30, delay is 10 ms)
== Flow ID 33434 ==
1    192.168.43.1 (gateway), IP ID: 17503 RTT 7.657 ms  ICMP (type=11, code=0) 'TTL expired in transit', NAT ID: 0, flow hash: 25516
2    *
3    172.16.0.213 (172.16.0.213), IP ID: 0 RTT 59.862 ms  ICMP (type=11, code=0) 'TTL expired in transit', NAT ID: 0, flow hash: 25516
4    172.23.5.194 (172.23.5.194), IP ID: 0 RTT 65.349 ms  ICMP (type=11, code=0) 'TTL expired in transit', NAT ID: 0, flow hash: 25516
5    *
6    213.191.237.45 (213.191.237.45), IP ID: 61214 RTT 50.283 ms  ICMP (type=11, code=0) 'TTL expired in transit', NAT ID: 0, flow hash: 25516
7    213.191.237.46 (213.191.237.46), IP ID: 60862 RTT 45.321 ms  ICMP (type=11, code=0) 'TTL expired in transit', NAT ID: 0, flow hash: 25516
8    172.16.161.14 (172.16.161.14), IP ID: 38099 RTT 61.53 ms  ICMP (type=11, code=0) 'TTL expired in transit', NAT ID: 0, flow hash: 25516
9    *
10    *
11    172.16.101.1 (172.16.101.1), IP ID: 0 RTT 40.522 ms  ICMP (type=11, code=0) 'TTL expired in transit', NAT ID: 42753 (NAT detected), flow hash: 25516
12    193.120.76.205 (tengig4-3.ea101.bmt.esat.net), IP ID: 60944 RTT 40.795 ms  ICMP (type=11, code=0) 'TTL expired in transit', NAT ID: 42753, flow hash: 25516
13    193.95.130.1 (bundle-ether127.10.rt101.bmt.btireland.net), IP ID: 54623 RTT 41.168 ms  ICMP (type=11, code=0) 'TTL expired in transit', NAT ID: 42753, flow hash: 25516
14    193.95.129.96 (193.95.129.96), IP ID: 11148 RTT 57.186 ms  ICMP (type=11, code=0) 'TTL expired in transit', NAT ID: 42753, flow hash: 25516
15    193.95.129.135 (bundle-ether24.br002.bmt.btireland.net), IP ID: 42365 RTT 52.70 ms  ICMP (type=11, code=0) 'TTL expired in transit', NAT ID: 42753, flow hash: 25516
16    *
17    216.239.43.3 (216.239.43.3), IP ID: 61147 RTT 47.72 ms  ICMP (type=11, code=0) 'TTL expired in transit', NAT ID: 42753, flow hash: 25516
18    8.8.8.8 (google-public-dns-a.google.com), IP ID: 39240 RTT 68.68 ms  ICMP (type=3, code=3) 'Destination port unreachable', NAT ID: 42753, flow hash: 25516
== Flow ID 33435 ==
1    192.168.43.1 (gateway), IP ID: 17532 RTT 5.152 ms  ICMP (type=11, code=0) 'TTL expired in transit', NAT ID: 0, flow hash: 25517
2    *
3    172.16.0.213 (172.16.0.213), IP ID: 0 RTT 46.750 ms  ICMP (type=11, code=0) 'TTL expired in transit', NAT ID: 0, flow hash: 25517
4    172.23.5.194 (172.23.5.194), IP ID: 0 RTT 41.670 ms  ICMP (type=11, code=0) 'TTL expired in transit', NAT ID: 0, flow hash: 25517
5    *
6    213.191.237.45 (213.191.237.45), IP ID: 61229 RTT 41.929 ms  ICMP (type=11, code=0) 'TTL expired in transit', NAT ID: 0, flow hash: 25517
7    213.191.237.46 (213.191.237.46), IP ID: 60864 RTT 41.824 ms  ICMP (type=11, code=0) 'TTL expired in transit', NAT ID: 0, flow hash: 25517
8    172.16.161.14 (172.16.161.14), IP ID: 38105 RTT 41.803 ms  ICMP (type=11, code=0) 'TTL expired in transit', NAT ID: 0, flow hash: 25517
9    *
10    *
11    172.16.101.1 (172.16.101.1), IP ID: 0 RTT 41.473 ms  ICMP (type=11, code=0) 'TTL expired in transit', NAT ID: 42753 (NAT detected), flow hash: 25517
12    193.120.76.205 (tengig4-3.ea101.bmt.esat.net), IP ID: 60955 RTT 46.598 ms  ICMP (type=11, code=0) 'TTL expired in transit', NAT ID: 42753, flow hash: 25517
13    193.95.130.1 (bundle-ether127.10.rt101.bmt.btireland.net), IP ID: 54626 RTT 83.564 ms  ICMP (type=11, code=0) 'TTL expired in transit', NAT ID: 42753, flow hash: 25517
14    193.95.129.96 (193.95.129.96), IP ID: 6587 RTT 78.430 ms  ICMP (type=11, code=0) 'TTL expired in transit', NAT ID: 42753, flow hash: 25517
15    193.95.129.135 (bundle-ether24.br002.bmt.btireland.net), IP ID: 52380 RTT 134.670 ms  ICMP (type=11, code=0) 'TTL expired in transit', NAT ID: 42753, flow hash: 25517
16    *
17    66.249.95.91 (66.249.95.91), IP ID: 58171 RTT 119.80 ms  ICMP (type=11, code=0) 'TTL expired in transit', NAT ID: 42753, flow hash: 25517
18    8.8.8.8 (google-public-dns-a.google.com), IP ID: 57371 RTT 113.685 ms  ICMP (type=3, code=3) 'Destination port unreachable', NAT ID: 42753, flow hash: 25517
...
Saved JSON file to trace.json .
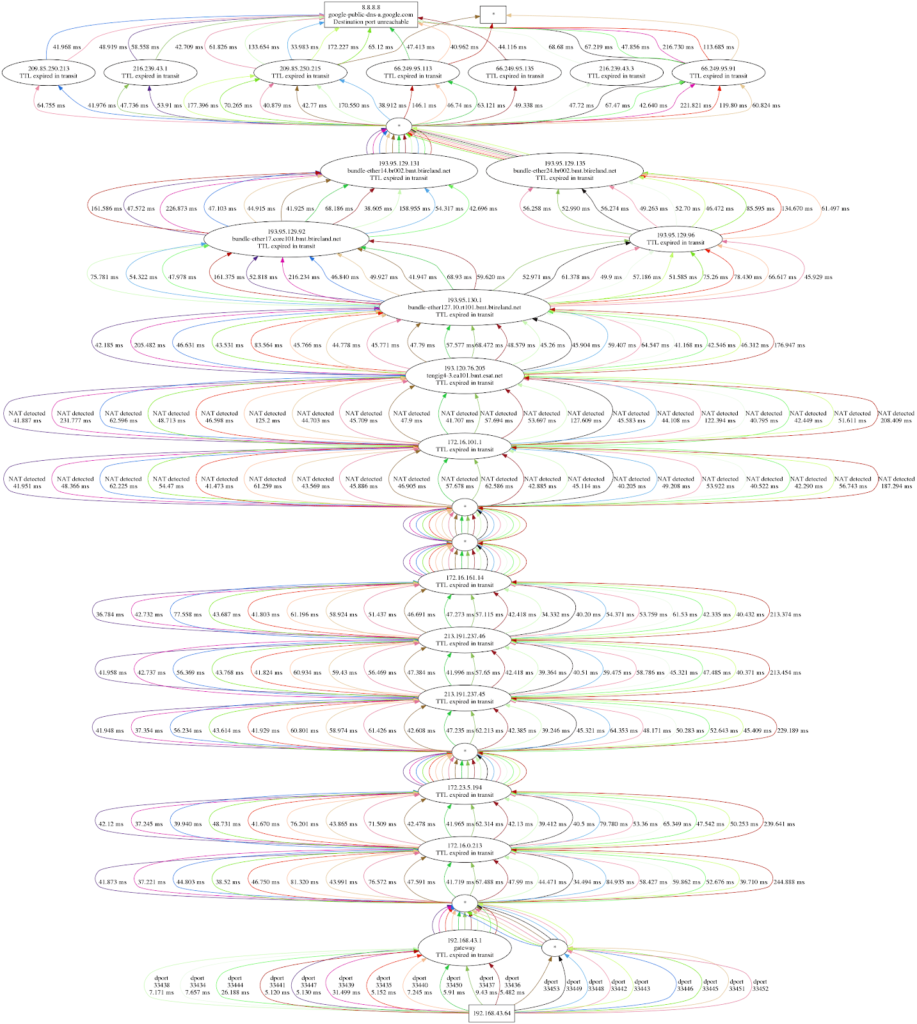
You can convert it to DOT by running python -m dublintraceroute plot trace.json
Reference: https://blog.dublin-traceroute.net/2017/10/a-picture-is-worth-a-thousand-words/
These are just two out of the 20 flows that Dublin traceroute generates by default. This includes lots of information, and it might be difficult to read. The last line of the text output informs you that you can plot this by using the Python Dublin traceroute module with python -m dublintraceroute plot trace.json. It looks like this:

The above visual representation (reference: https://blog.dublin-traceroute.net/2017/10/a-picture-is-worth-a-thousand-words/) might be more pleasing to the eye, but there’s lots of value to the text output as well, since it allows you to sort through traversed NATs more easily.
Although Dublin traceroute is a superset of regular traceroute, I don’t think it should be the first tool you should use when troubleshooting. The regular traceroute is easier to visually parse and understand. In addition if you are on a WAN network and you know the topology Dublin might not add any value unless you have ECMP on the network. Also, Dublin traceroute doesn’t give you metrics such as packet loss and jitter the same way mtr does out of the box.
All in all it’s a great tool and I am looking forward to learning more about it and exploring how I can use it productively.


