How to Detect a Routing Change
The data revolution has taken the IT work by storm. It’s easy to collect an endless stream of network monitoring data from your network (SNMP, NetFlow, IP SLA). But then what? How can you extract the few meaningful pieces of information needed to manage your network?
The ability to quickly narrow down a problem is on everyone’s mind when there is something wrong with your network. Here, I will demonstrate how you can peel off layers of information with just a few clicks to drill down to the root cause of an HTTP GET failure at a specific branch office.
Troubleshooting Procedure
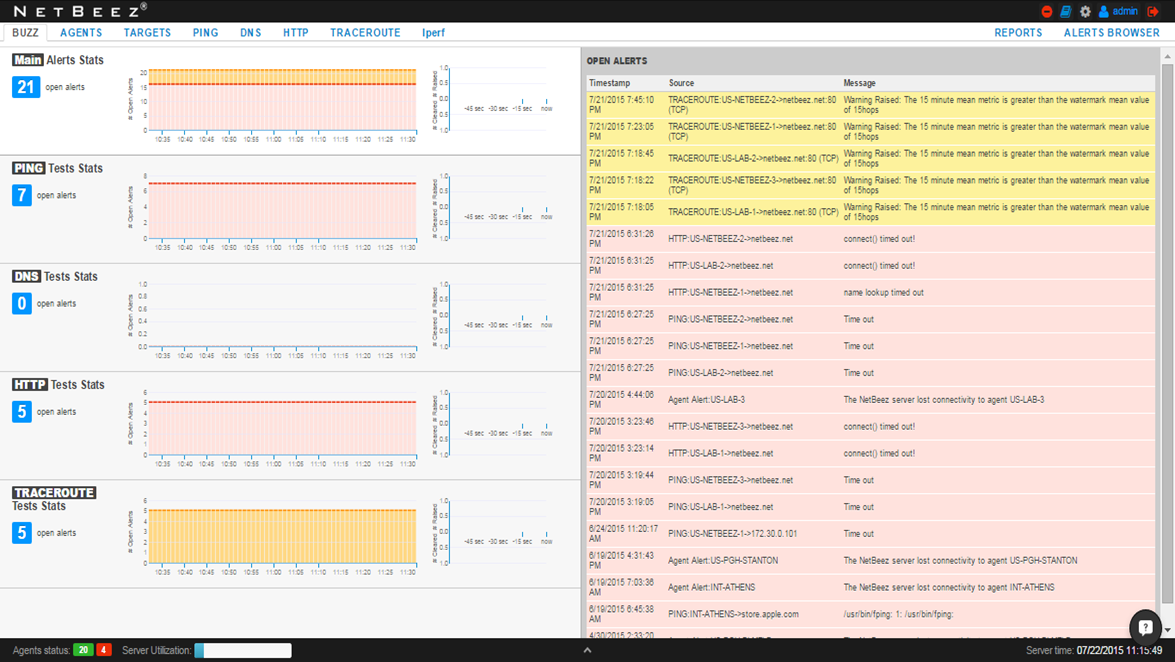
Step 1: What’s the overall status of my network?
First, you’ll want to get a bird’s eye view of your network. This should always be your first step in troubleshooting, because at the highest tier of abstraction you can confirm overall network status and immediately detect any irregularities. This information is provided by the “BUZZ” (shameless pun intended) view on the NetBeez dashboard.
It’s as simple as that!
As an example, the NetBeez dashboard below shows that there are 21 total open alerts.
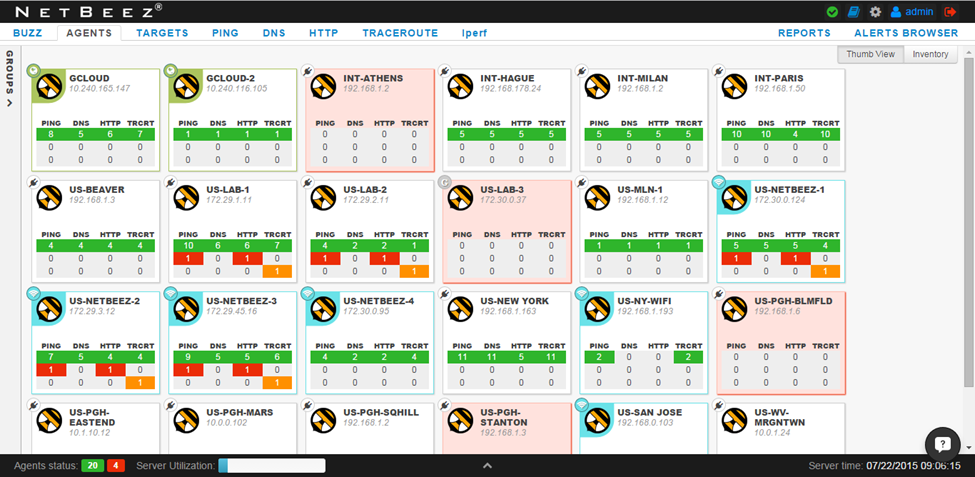
Step 2: Which locations are affected?
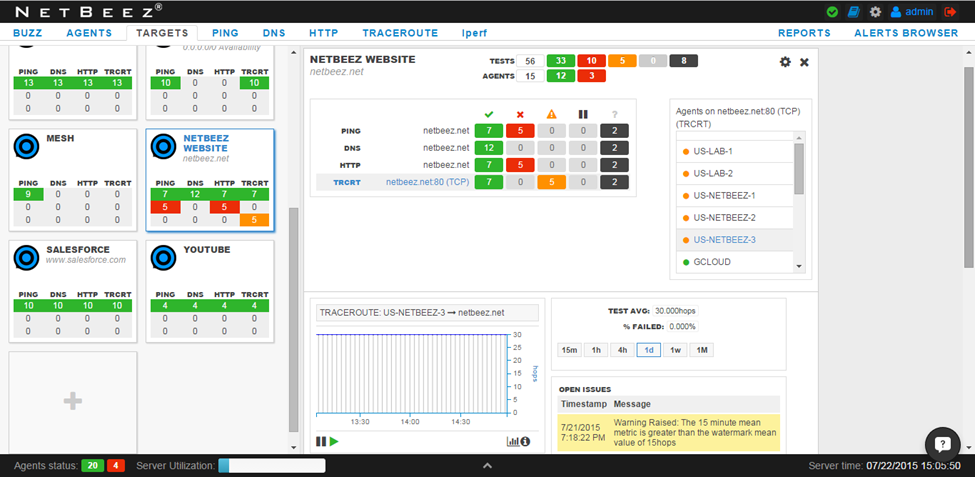
The “AGENTS” view is our second layer of abstraction, in which we can find the status of each location in our network. Very quickly we see that the only live agents experiencing alerts are US-LAB-1 and -2, and US-NETBEEZ-1, -2, and -3. Turns out all 5 of these agents are located in our Pittsburgh office, which tells me that the problem is likely isolated to that location only.
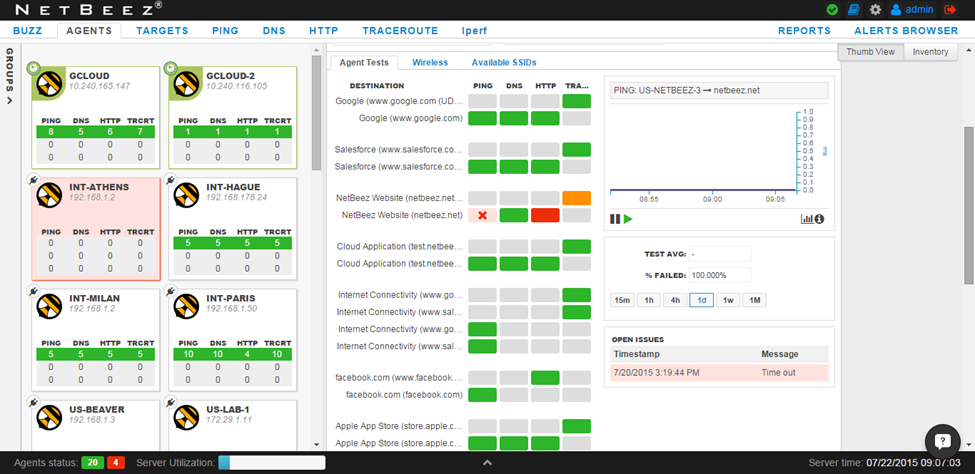
To dig a little deeper, let’s click on agent US-NETBEEZ-3. Now I see that the Ping and HTTP tests started failing around the same time: Sunday 7/20/2015, approximately 3:19:44 PM.
Step 3: Is the problem local or global?
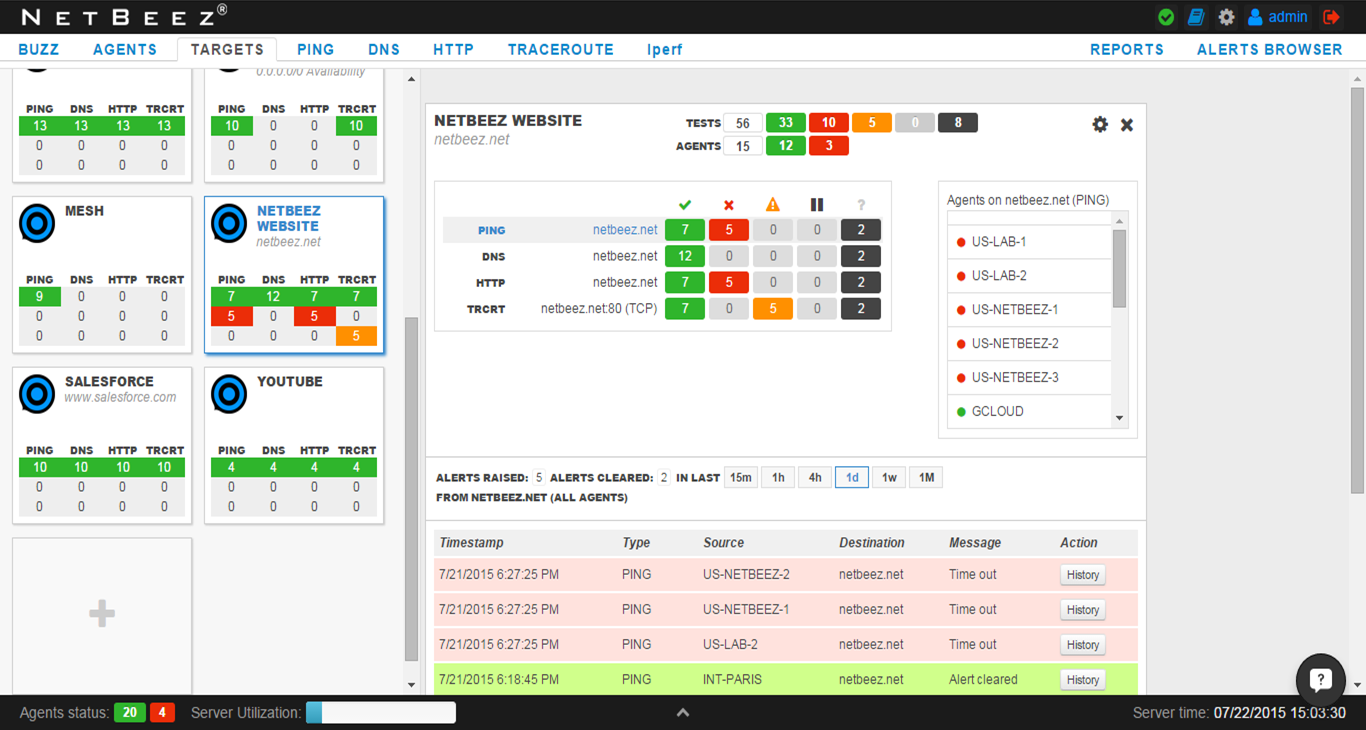
The next question I want to answer is how far does the issue reach? Are the failures only occurring at our Pittsburgh office, or are other locations experiencing issues as well? To answer this question with confidence, we move to the “TARGETS” view. Specifically we are looking at the target “NETBEEZ WEBSITE” which monitors netbeez.net from many different geographic locations. Fortunately, at least one agent (GCLOUD) is able to Ping and perform an HTTP GET to netbeez.net. That means the problem is isolated to our Pittsburgh office.
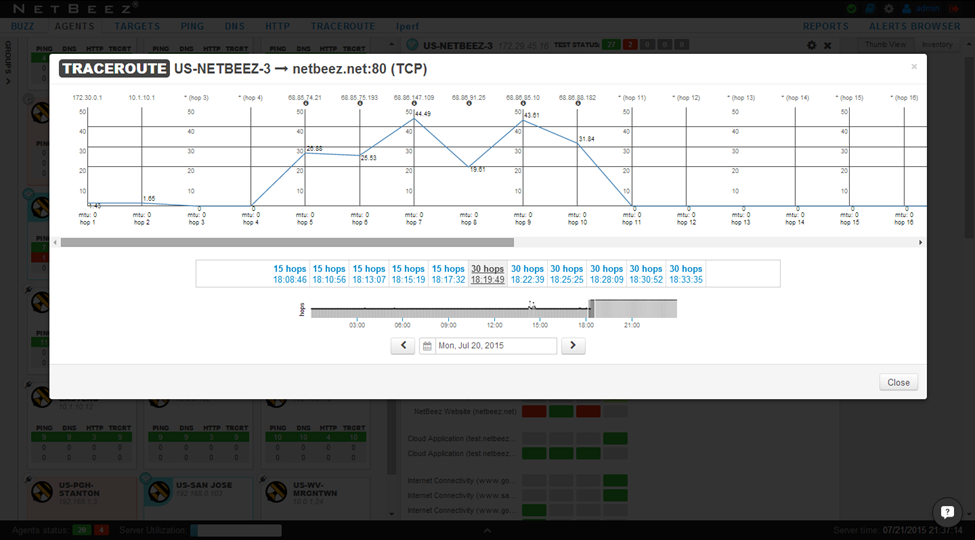
Step 4: I suspect it’s a routing problem. Can I verify this assumption?
One test we haven’t looked at is traceroute. By taking a look at the traceroute historical data around the time that the Ping and HTTP tests start failing, we learn that there was a routing change. Before the failure the Pittsburgh agents were able to reach netbeez.net in 15 hops. However, on 7/20/2015 at 6:19:49 PM the traceroute stopped being able to reach netbeez.net. It’s likely that a routing change (usually from our ISP) is preventing our office from accessing netbeez.net. We’d better call our provider and let them know!
That’s it! Using 4 views in our Dashboard (BUZZ, AGENTS, TARGETS, TRACEROUTE), we were able to efficiently narrow down the root cause of the Ping and HTTP failures happening in our Pittsburgh branch.
Synthetic end-user monitoring agents act as virtual users in your network, and in real-time report the status of the network and its services and applications via the Dashboard. When something goes wrong, you can spot it immediately, before a user picks up the phone to call the help-desk. Historical data allows you to pinpoint triggering events and troubleshoot faster.