 The first times I wrote software tool that other people besides me could download and use was during graduate school at Lehigh University and my research years at Carnegie Mellon University. Something to point out is that the software was open source and free. Then, being a cofounder of NetBeez, I had to write software that people would pay money to use. Before then, I was a just a user of commercial or free tools. Being on the other side of the table taught me a lot about what is important in developing software that is not intended solely for me.
As a user, I always wanted all the software to be free and get its job done the best way possible. But the most important factor that made me a happy user was the ease of use. By nature we resist change. So, whenever it felt like I had to “learn” how to use a tool, I would either quit within five minutes or be frustrated until I mastered it.
It’s a very delicate balance to develop a tool that fulfills its purpose without getting in the way. We don’t appreciate good UI/UX design when it is intuitive to use, doesn’t have bugs, and delivers what it promises without compromises: “a successful referee is the one that nobody knows about.”
I couldn’t fathom how difficult it would be to achieve that until I started working on NetBeez. The purpose of the tool is to proactively detect network and application issues that affect users at remote WAN locations. NetBeez collects end-user monitoring data from dozens or hundreds of agents (one per location), and needs to present and visualize that to the user in a way that makes it easy to understand what is important without clutter.
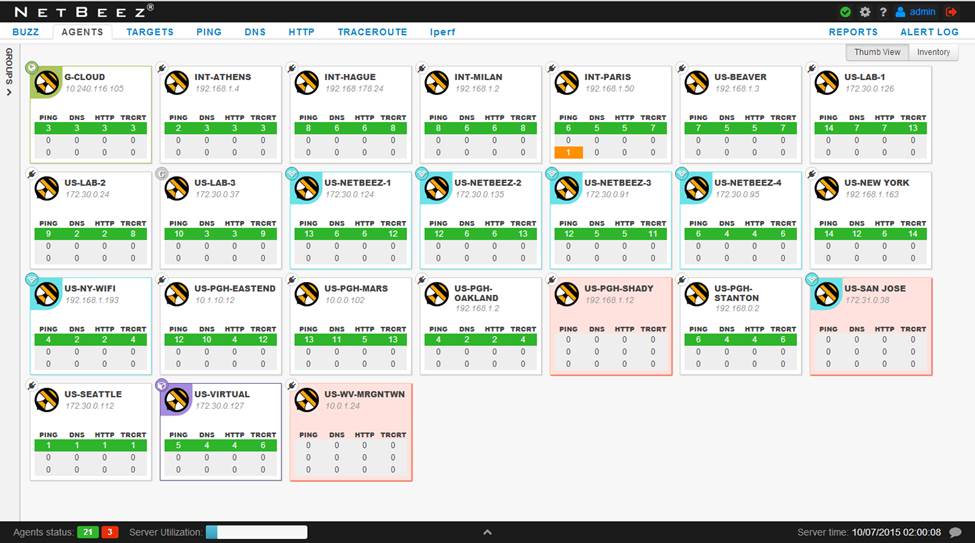
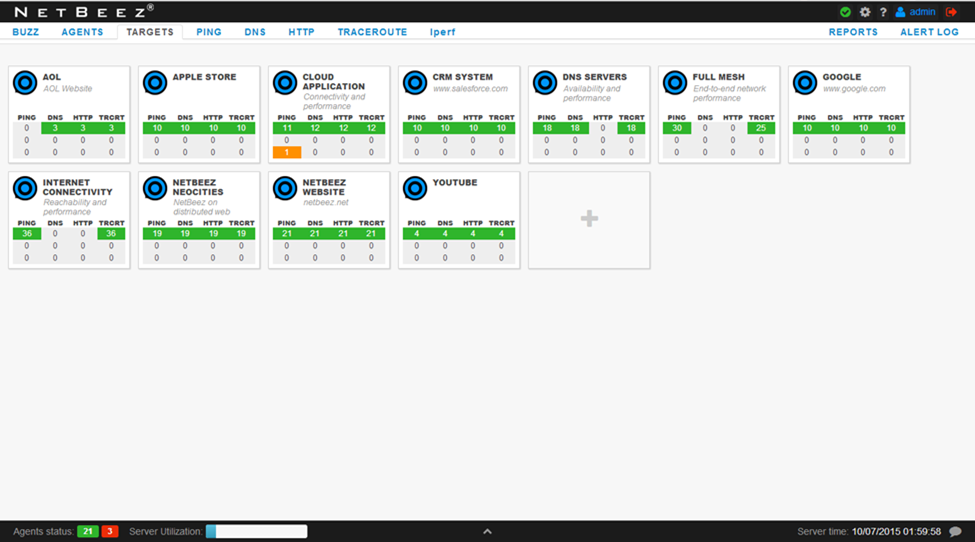
When an issue comes up, the two most important pieces of information NetBeez provides are which locations are affected and what resources are suffering (network, application, services, etc). We solved this by providing two views of the locations and resources the user is monitoring: the Agent View and the Target View.
As an example, on the Agent View, we see that one of the ping tests at Paris has a performance issue as denoted by the orange tile.

Moving to the Target View, we can very easily see that the performance alert is coming from the cloud application we are monitoring.

We can now focus our attention on the Paris location and the cloud application and use the rest of the NetBeez data to find the root cause of the problem and fix it.
A legitimate question is, “What would the NetBeez dashboard look like if you had hundreds of agents and not just 24?” Well, the other thing I learned by working on NetBeez is that if the tool doesn’t evolve to become even easier to use under more challenging requirements it will eventually die. So, stay tuned for the upcoming releases of NetBeez.
[newsletter_signup]


