When I was a computer science student I spent a lot of time playing around with Linux, gaining valuable linux experience through hands-on experimentation. My home network was routed by a Pentium 2 workstation running Slackware and configured with IP forwarding and IP tables. In 2003, I attended a CCNA boot camp; the other students and I practiced routing protocols (RIP and OSPF) by building an overlay point-to-point network between our houses. We used OpenVPN for the tunneling and then RIP and OSPF inside the tunnels.
For the routing process, we first used Zebra and then Quagga (which at the time supported OSPF). It’s great to see that now, 20+ years later, open networking companies have adopted those same projects to finally deliver enterprise-grade routing and switching. Many of these core networking concepts and tools have their roots in unix systems, which have long been foundational in the networking world.
So what does all this have to do with network engineering? For anyone pursuing a career in this field, it’s essential to learn linux as a foundational skill.
Network Engineers and Linux Utilities
Well, I think that having a basic knowledge of Linux is no longer just for students and computer geeks. Network engineers will often run into Linux-based network operating systems and command lines. Having a basic knowledge of Linux is a neccesity.
Taking a course focused on Linux for network engineers can accelerate the learning process and provide hands-on experience with essential tools like GNS3 and virtual machines.
Even when I first became a full-time network engineer, my Linux skills have helped me with the tasks of design, implementation, and support of enterprise networks. I was able to efficiently collect information needed to do network design, verify routing and availability during the implementation phase, and grab troubleshooting data necessary to quickly fix outages that impact users. Below, I would like to list some of the command line utilities that saved my network many times
Choosing a Linux Distro for Network Engineering
Selecting the best Linux distro for network engineering is a crucial decision that can impact your workflow, system stability, and access to essential networking tools. With so many Linux distributions available, network engineers need to weigh factors like security, long term support, and the availability of up-to-date software.
Red Hat Enterprise Linux (RHEL) is a top choice for professionals who prioritize stability and enterprise-grade support. RHEL is renowned for its robust security features and long term support, making it a good option for mission-critical network systems. For those who want a free alternative with similar features, CentOS Stream offers a continuously updated operating system that closely tracks RHEL, providing a balance between cutting edge features and reliability.
Ubuntu is another popular Linux distribution among network engineers, thanks to its user-friendly interface, extensive community support, and a vast repository of networking tools. Whether you’re setting up a server, configuring a virtual machine, or experimenting with different desktop environments, Ubuntu’s flexibility and ease of installation make it a strong contender for both beginners and experienced users.
Ultimately, the best Linux distro for network engineers depends on your specific needs—whether you value enterprise support, want to experiment with the latest software, or need a free, stable platform for your networking projects. By choosing the right Linux distribution, you’ll ensure your operating system is well-suited for network configuration, security, and ongoing support.
Nmap
Nmap is the network security scanner of choice. It can give you useful information about what’s running on network hosts. It’s also so famous that it has been featured in many movies. With Nmap you can, for example, scan and identify open and filtered TCP/IP ports, check what OS (operating system) is running on a remote host, and do a ping sweeps on an IP subnet or range.
List open ports on a host
Knowing which TCP/IP ports of a host are listening for incoming connections is crucial, especially when you’re hardening a server or locking down network equipment. Nmap allows you to quickly verify that: just run the Nmap command followed by the hostname or fully qualified domain name.
root@gonzo:~# nmap 10.1.10.1

Starting Nmap 5.00 ( http://nmap.org ) at 2016-02-17 06:38 EST
Interesting ports on 10.1.10.1:
Not shown: 998 closed ports
PORT STATE SERVICE
80/tcp filtered http
443/tcp open https
MAC Address: C4:04:12:BE:5A:1C (Unknown)

Nmap done: 1 IP address (1 host up) scanned in 9.54 seconds
root@gonzo:~#
In this example, you have host 10.1.10.1 with MAC address C4:04:12:BE:5A:1C and with open ports 80 and 443.
Some useful options are:
- –O Enable OS (operating system) detection
- -p Port range (e.g. -p22-123)
- -sP Ping sweep of a subnet (e.g. 192.168.0.0/24) or range of hosts
Ping Sweep on an IPv4 Subnet
A ping sweep is an essential technique in the toolkit of any network engineer, allowing you to quickly identify which hosts are active on a given IPv4 subnet.
By sending ICMP echo requests to a range of IP addresses, you can determine which devices are online and responsive—an invaluable step for network security audits, troubleshooting, and inventory management.
Network engineers often use the ping command in combination with scripts, or leverage powerful tools like Nmap to automate the process. For example, running:
nmap -sP 192.168.1.0/24will scan the entire subnet and list all active hosts. This information is crucial for creating an up-to-date inventory of network devices, identifying unauthorized systems, or preparing for more advanced network security testing.
For those interested in penetration testing or more comprehensive network analysis, distributions like Kali Linux come preloaded with advanced tools designed for network security professionals. Mastering ping sweeps and similar network scanning techniques not only sharpens your Linux skills but also enhances your ability to secure and manage complex network environments.
Whether you’re troubleshooting connectivity issues or conducting a security assessment, these foundational Linux commands and tools are indispensable for any network engineer.
Ping sweep on a IPv4 subnet
Ping sweeps are great to create an inventory list of hosts in a network. Use it with caution and don’t simply scan the entire 10.0.0.0/8 subnet. Rather, go subnet per subnet (e.g. 10.1.1.0/24).
I used this option many times when I was replacing the routers at large sites. I would create an IP inventory list before and after my configuration change to make sure that all the hosts would see the new gateways and could reach the outside world.
Ping sweeps can also be performed within virtual machines to safely test network configurations. Experimenting with different operating systems, such as FreeBSD, in virtual machines can broaden a network engineer’s practical experience.
root@gonzo:~# nmap -sP 10.1.10.0/24
 Starting Nmap 5.00 ( http://nmap.org ) at 2016-02-17 06:35 EST
 Host 10.1.10.1 is up (0.011s latency).
 MAC Address: C4:04:12:BE:5A:1C (Unknown)
 Host 10.1.10.10 is up (0.00049s latency).
 MAC Address: C8:B4:71:21:11:37 (Unknown)
 Host 10.1.10.11 is up (0.000091s latency).
 MAC Address: C8:D2:11:10:E4:FD (Unknown)
 Host 10.1.10.12 is up (0.00052s latency).
 MAC Address: B8:27:EB:05:11:27 (Unknown)
 ...
 Nmap done: 256 IP addresses (13 hosts up) scanned in 2.47 seconds
 root@gonzo:~#
Real-time ping sweeps
Do you want real-time ping sweep of a subnet? The following bash script will continuously execute a ping sweep to subnet 192.168.1.0/24 every 5 seconds. To exit the command, just hit CTRL-C.
while [ `clear` ]; do nmap -sP 192.168.1.0/24; sleep 5; doneTcpdump
Tcpdump is the tool that you want to use to analyze traffic sourced or destined to your own host or capture traffic between two or more endpoints (also called sniffing).
To sniff traffic, you will need to connect the host running tcpdump to a SPAN port (also called port mirroring), to a hub (if you can still find one), or a network TAP.
You may also need to configure the network interface or system settings appropriately to ensure you capture the desired traffic. This will allow you to intercept and process all captured traffic with tcpdump or analyze network packets with ngrep. Just execute the command with the -i option to select what interface to use (eth0), and the command will print all traffic captured:
tcpdump -i eth0Tpcdump is a great utility to troubleshoot network and application issues. For example, at remote sites that are connected with IPSec tunnels back to the main site, many times I was able to figure out why some traffic would make it through the tunnel and some wouldn’t. The cause was that some traffic that used the entire IP payload without accounting for the IPSec header had the DF bit set. As results, the router would return an ICMP packet with code “Can’t Fragment Error”, something that I found out with tcpdump.
Here are some basic options that you should know about to use tcpdump:
Capture all traffic from host 192.168.0.1
tcpdump src 192.168.0.1… to host 192.168.0.1
tcpdump dst 192.168.0.1Capture all ICMP traffic
tcpdump icmp… all traffic sourced from port 80
tcpdump src port 80… all traffic destined to port 80
tcpdump dst port 80Iperf
Use this tool to assess the bandwidth available between two computers. Iperf is commonly used to test network performance between servers in enterprise environments. You can pick between TCP or UDP traffic and set the destination port, bandwidth rate (if UDP is selected), DSCP marking, and TCP window size. With iperf you can also generate multicast traffic and test your PIM infrastructure.
I’ve used iperf many times to troubleshoot network slowness issues, verify whether the ISP would honor the DSCP marking, and measure the jitter value of UDP traffic. We have already written a post about using iperf in distributed monitoring, so I encourage you to read that if you want to learn more.
Hping3
Hping3 is a utility command very similar to ping, with the difference that it can use TCP, UDP, and RAW-IP as transport protocols.
This command allows you to not only test if a specific TCP/IP port is open, but allows you to measure the round-trip time. Note that certain options or protocols may only be available depending on the version of hping3 installed, so it is important to check your version for compatibility.
For example, if you want to test whether google.com has port 443 open and measure the round-trip time, you can type:
root@gonzo:~# hping3 www.google.com -S -V -p 443
using eth0, addr: 10.1.10.23, MTU: 1500
HPING www.google.com (eth0 74.125.138.103): S set, 40 headers + 0 data bytes
 len=46 ip=74.125.138.103 ttl=43 id=27101 tos=20 iplen=44
 sport=443 flags=SA seq=0 win=42900 rtt=111.7 ms
 seq=4259160195 ack=953424163 sum=ef0b urp=0

DUP! len=46 ip=74.125.138.103 ttl=43 id=27258 tos=20 iplen=44
 sport=443 flags=SA seq=0 win=42900 rtt=412.0 ms
 seq=4259160195 ack=953424163 sum=ef0b urp=0

len=46 ip=74.125.138.103 ttl=43 id=48819 tos=20 iplen=44
 sport=443 flags=SA seq=1 win=42900 rtt=32.7 ms
 seq=3928592912 ack=1609881980 sum=9b46 urp=0

DUP! len=46 ip=74.125.138.103 ttl=43 id=48997 tos=20 iplen=44
 sport=443 flags=SA seq=1 win=42900 rtt=331.4 ms
 seq=3928592912 ack=1609881980 sum=9b46 urp=0
Here are the options I used:
- -S Set the SYN tcp flag
- -V Enable verbose output and display more information about the replies
- -p Set the TCP/IP destination port
Netcat
Netcat (nc) is the network engineer’s Swiss Army knife. Developers also rely on netcat for testing and debugging network services. If you want to be the MacGyver of your network, you must know the basics of netcat.
If you use it in client mode, it’s similar to telnet, and you can create a TCP connection to a specific port and send anything that you type. You can also use it to open a TCP/IP port and read from standard input. That makes it an easy way to transfer files between two computers.
Another use case is testing whether your firewall is blocking certain traffic. For example, execute netcat in server mode on a host behind your firewall and then execute netcat in client mode from outside the firewall. If you can read on the server whatever you type on the client, then the firewall is not filtering the connection.
nc -l -p 1234This executes netcat in server mode on port 1234 and waits for incoming connections
nc destination_host 1234This executes netcat in client mode and connects to TCP port 1234 on remote host destination_host You can also use netcat with pipe commands. For example you can compress a file before sending it to the remote host with netcat:
tar cfp - /some/dir | compress -c | nc -w 3 othermachine 1234Console access on NetBeez agents
We understand how important is to have access to the Linux command line. For this reason, the new release of NetBeez (0.11.2) allows administrator users to have direct access to the agent’s console from the Agent Details view, providing direct interaction with the underlying linux system of the agent:
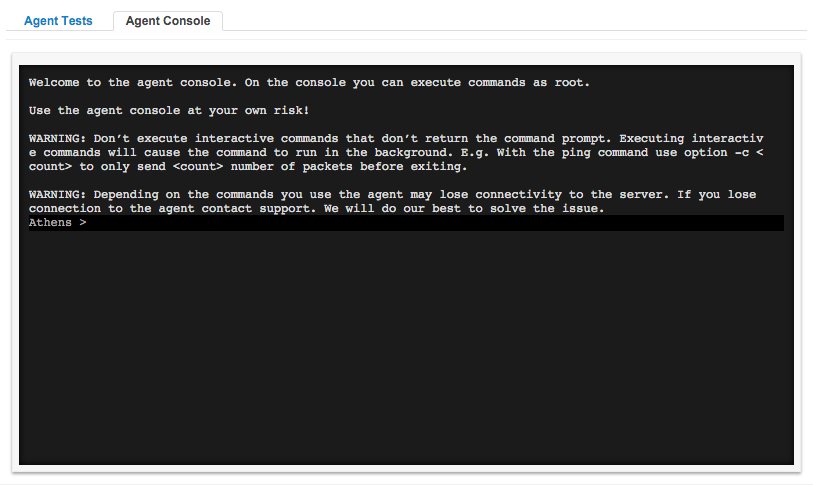
Please be aware that the command line is non-interactive. What that means is that if you execute a command, you will receive immediately the prompt back and also the output of the command you typed. If a command expects more user inputs (say a text editor like vim or nano) or a dialog command, you won’t see it and won’t be able to interact with it.
In contrast, a GUI (Graphical User Interface) on linux systems allows for interactive graphical operations, but this is not available in the current console setup. For this reason, it’s very important that any command typed on the console terminates after a certain period without expecting further user inputs, otherwise it would run in background. For example, if you are running a ping test, you will have to use the count option (-c), otherwise it will run continuously in background.
ping -c 5 www.google.comThis will cause the shell to send 5 ICMP echo request packets before exiting. If, by mistake, you have typed a command that does not return the prompt, it is necessary to kill it by identifying first the process ID (PID) with:
ps ax… and then terminate the process with:
killConclusion on Linux Utilities
I hope this blog post was helpful for learning some useful Linux tricks that will make your life easier. Please feel free to share with us which other Linux command line utilities are in your toolbox.