Recently, we toured Pittsburgh, Cleveland as well as three cities in Texas (Austin, San Antonio, and Houston) together with the folks from AngelBeat; AngelBeat, is an event tour that stops in one city every day, all year long, throughout the entire country and connects vendors with local IT practitioners.
I encourage you to check out their tour schedule. There are so many great vendors showcasing their latest products. Each event is free, includes lunch and refreshments, and, as an attendee, you have the opportunity not only to interact with vendors but also with other IT guys and share experiences and perspectives on networking, storage, wireless, virtualization, … anything that has a CPU and that processes bits or bytes.
What we like about AngelBeat is that it is, by nature, an educational event. It’s not a bunch of sales pitches, because where the value is, for an attendee, is learning about new technologies and the latest products released by vendors. For NetBeez, it’s a great occasion to educate our audience on the benefits of distributed network monitoring in large Wide Area Networks.
We have also uploaded our deck on SlideShare, you can find it here: http://www.slideshare.net/netbeez/troubleshooting-wan-with-distributed-network-monitoring
In the presentation you will find three use cases, two of which I would like to describe in this post:
- How network performance affects application performance
- How wireless performance can be measured from the user perspective
How network performance affects application performance
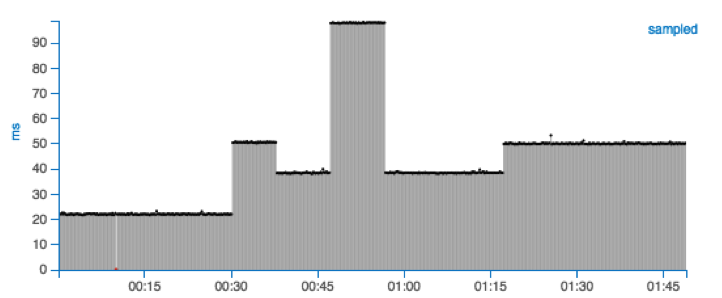
The following use case shows how network performance, measured in round-trip-time with a PING test, affects the response time of a web service, measured with the HTTP GET time of an HTML page. In this case, we are using Google’s search engine as a target.
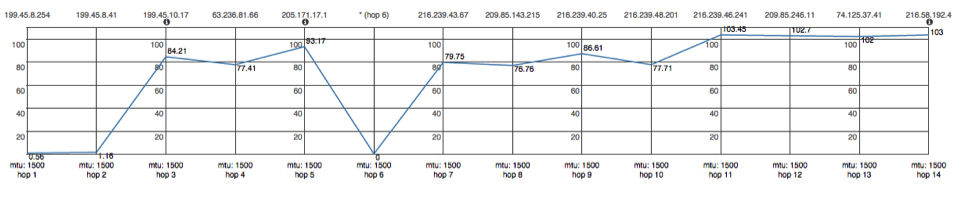
As you can see from the following screenshot of a NetBeez’ real-time graph of a PING test to google.com, we can identify the typical step function, where the round-trip-time consistently changes for a finite time interval.
If we now review the NetBeez real-time graph of an HTTP GET test to the same destination, google.com, we see that the same step function, or pattern, is visible.
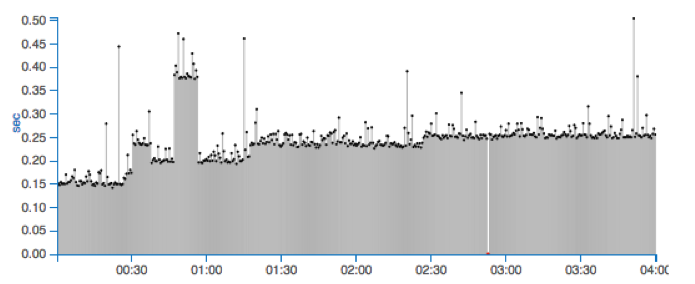
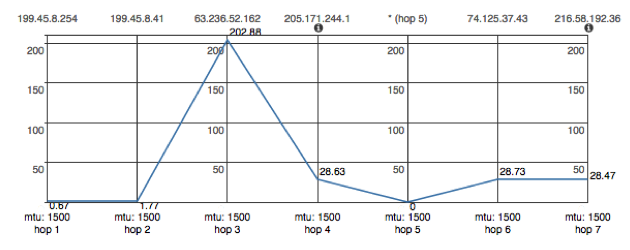
Above is a clear demonstration of how network performance adds up to application performance. The reason of this behavior is due to a routing change, where the number of hops between the source, the NetBeez agent, and the destination, google.com, increased from 7 to 14 hops.
How wireless performance can be measured from the user perspective
In this use case, we want to show how application performance degrades due to oversubscription of wireless resources. This behavior is common to those environments where there is a lot of user turnover, such as coffee shops, libraries, hotels, universities, and trade shows. For these areas in particular, monitoring a wireless infrastructure from the network perspective is not enough.
The majority of wireless controllers or node managers don’t have a way to measure the client’s performance. As result, the wireless engineer must often resort to guesswork when troubleshooting performance issues because there are no data to assess whether the degradation is caused by the client (e.g. drivers), by environmental factors (e.g. interference), or by oversubscription.
NetBeez has an easy-to-use data-driven solution to address this problem. The wireless engineer can install wireless agents and configure them to run PING, DNS, and HTTP tests to monitor network and application performance. Associated with these tests are performance alerts that will proactively detect performance degradation issues. This is helpful or even essential in critical areas where demand for wireless resources vary frequently and design reviews are necessary.
The following screenshot of an HTTP test run by a wireless agent offers a good example for oversubscription of wireless resources:
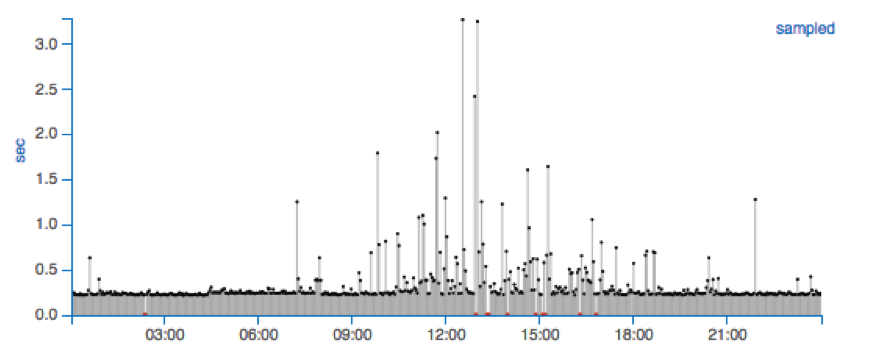
As you can see, application performance degradation starts around 9:00AM and terminates around 6:00PM. Why? That is the time period when more users show up at the location where the wireless agent is deployed. Users start connecting with their phones, tablets, and laptops to the wireless network. As a result, in some cases, the average HTTP GET time spikes from 0.3 seconds to 3 seconds.
Below is a report that shows the difference of network performance between wired and wireless agents:
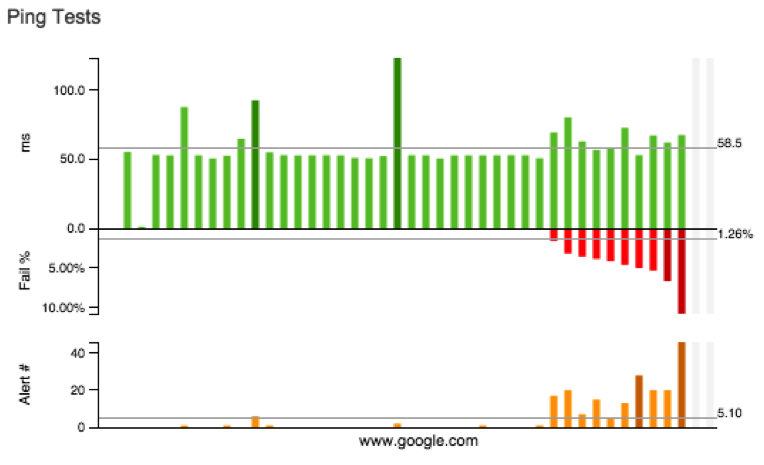
Each green bar is the average round-trip-time reported by one agent for a given time period while the red bar is the packet loss associated to that same test. Each orange bar represents the total number of alerts generated by the agent; this is a good way to identify what agents (or network areas) are problematic.
In this specific report, you can see that the agents that have high packet loss are wireless agents. The agents without any packet loss are wired. At the same time, the round-trip-time is fairly consistent because, from a routing perspective, they follow the same path.
I hope that these two use cases were beneficial to understand the benefits of distributed monitoring by use of active agents. If you want to learn more, I recommend to:
- Register to our latest webinar
- Watch the recorded webinar on how to monitor wireless networks from the client perspective
- … and, if you are ready for NetBeez, request a demo!