Network managers leading a team of engineers in support of a large enterprise network don’t have an easy job!
On the one hand, there is complexity that the engineers have to deal with due to running a large Wide Area Network where remote locations are connected back to the data center via different transport technologies, using various service providers. Each site may support users with different technical and business requirements in terms of applications used, quality of service needed, and availability.
On the other hand, there are the IT executives who expect the highest reliability and uptime with the lowest investment possible. Business executives care about two metrics: availability and performance. Problem is this: What tools are today’s network managers using to get these measurements?
Three ingredients are necessary to be successful: skilled engineers, budget, and data. Without data, network managers may lose skilled engineers and make bad decisions regarding budget investment. Let me explain why.
Key Performance Indicators
Key performance indicators of network and service quality are necessary to manage a network infrastructure and a team of engineers as they provide objective metrics to evaluate the efficiency and performance of an IT staff, aligning the goals of the engineers and IT executives. Without data, a network manager does not have a ground to argue the perception that users have on network availability and applications performance. This situation adds stress to the morale of the network manager and, consequently, on the overall team.
Key performance indicators also enable the best allocation and use of funds during budgeting season. The performance data, such as network round-trip-time, packet loss, and number of failures per time period, enable the network manager to discuss with the engineers the areas of the network that require a hardware upgrade, the review of the Service Level Agreements with internet service providers, or an audit of the network configuration such as review the QoS policy of remote sites.
A recent study from 451 Research pointed out that the top pain for network managers is network monitoring: the lack of end-to-end visibility makes it very difficult to troubleshoot application slowness issues and understand whether is the network or the application is causing problems. A distributed network monitoring solution that collects data from all the network locations and can measure network versus application performance can improve network operations.
Monitoring Enterprise Networks
Here are my recommendations on what type of data network managers need to successfully manage a network infrastructure:
- Monitor end-to-end availability and performance – Do not just rely on the up-down status of your network devices or on the statistics of bytes going in and out of the routers’ interface. The status and performance of your network cannot be described only by collecting data about the status and performance of individual components: managers need to see the bigger picture; you can read my previous blog on troubleshooting remote application issues and on types of network monitoring tools.
- Adopt a distributed monitoring solution – For every network location, you need network availability and application performance data, like round trip time and packet loss for the network layer, and response time for the application layer.
- Historical data is as important as real-time data – Real-time data enables IT to be proactive and avoid degradation of network and application performance; historical data is necessary to generate reports during budgeting season to determine which sites should be upgraded and also provides objective metrics to evaluate the efficiency and performance of your IT staff.
To conclude, take the following histograms of PING and HTTP tests performed against a cloud application from 23 NetBeez agents.
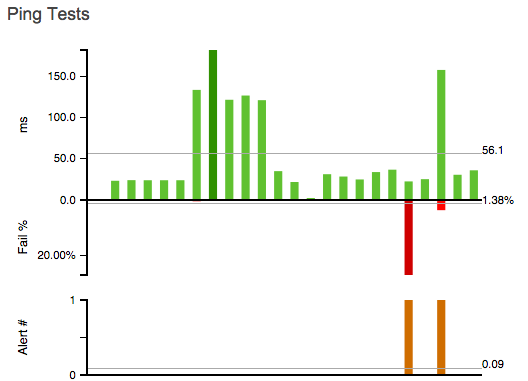
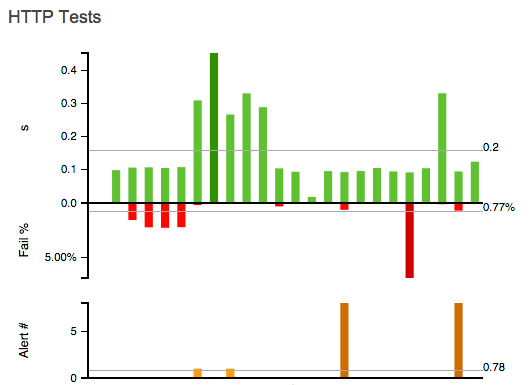
Each agent was installed at a different enterprise location, so the network manager and his team can rely on real performance data to assess the quality of the network. Each bar within a histogram represents the data collected by one agent: in green the round-trip-time (PING) and response-time (HTTP), in red the packet loss (PING) and the number of failed HTTP queries (HTTP), and in orange the number of alerts generated by each test. With this information, network managers and engineers can pinpoint locations that underperform compared to the average, identify problems in the network, and track the overall performance of the network team.
Network managers and engineers don’t have an easy job, but they can make their life easier by getting the data that is necessary to manage and control the complexity of a network infrastructure. Armed with such data, they can make the best use of their budget, time, and skill set at the disposal of the number one asset of an enterprise network, its user base. Download the remote network monitoring guide by NetBeez to learn about this.