There are several ways to get interface statistics on their network counters. The most basic one is to use the ip command (or the older ifconfig). There are other utilities too, but the common theme between them is that they give a snapshot of the network statistics and everything is left to the user. For example, if you want to plot a graph of some network metric or compare statistics between interfaces, you’d need to use some third party tool or a spreadsheet.
bmon is tool that overcomes these limitations, and takes network statistics to the next level.
Installation
bmon has been around for several years now, so you should be able to install it with something simple like:
apt-get install bmon
As of September 2021, installing bmon with apt-get installs the latest version of the tool, 4.0, which is the same as the one on github.
Usage
The simplest way to run bmon is to just type the command on the CLI without any arguments. You will get something like the following:
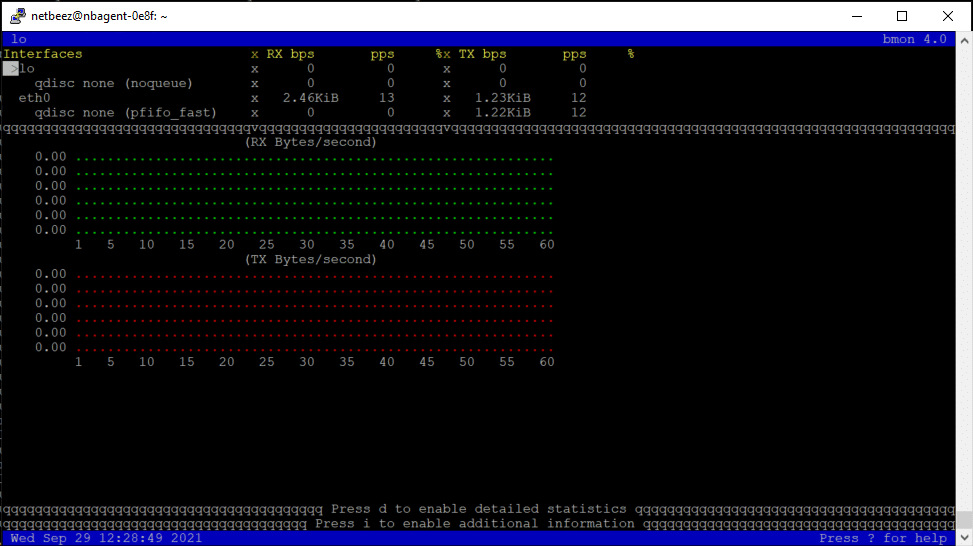
Actually, my blogpost could end here, because bmon has a pretty nice and comprehensive help menu on the application, so everything you need, can be most likely be found by pressing “?” to open the help menu. After you open bmon, the first commands to give are:
- ‘d’: to enable detail statistics
- ‘i’: to to enable additional information
- “h”: to enable recording of historical data
In addition, when I launch bmon I add the -b flag so that it uses bits as the measurement unit (and not bytes, which is the default). So, after launching it with:
bmon -b
And pressing “d, i, h” I get the following:
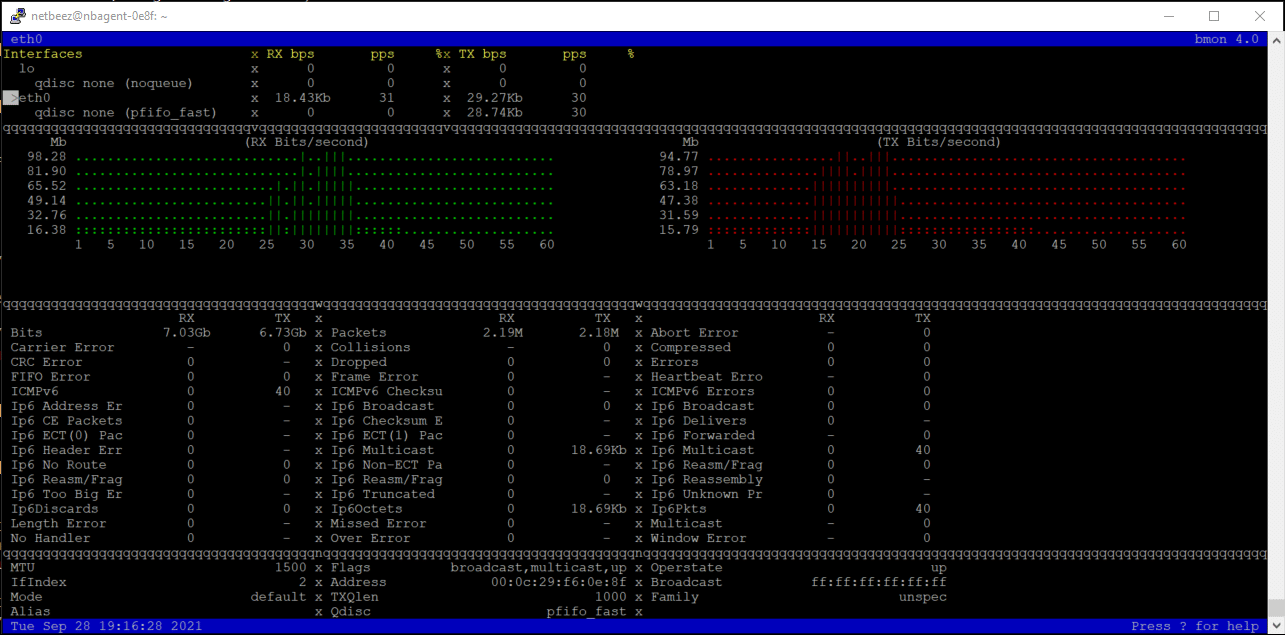
By default, the cursor will be on the “lo” loopback interface, and by using the down arrow I brought the cursor to the “eth0” interface. If you use the left/right arrows you will get different statistics on the plots.
In the example above I ran a speedtest so that there is a substantial amount of traffic on the interface to be recorded, and then I ran a speedtest, and you can clearly see what I was getting on my screen. The green Rx plot (download bandwidth) and red Tx plot (upload bandwidth) show values that are pretty close to the traffic measured by the speedtest itself.
bmon gives you a pretty complete picture of the network statistics on all the interfaces of the system and has a very good documentation. I would recommend it as a useful utility that you can use when troubleshooting network problems. After all, installing the latest version of bmon is very easy since it’s available on all repositories.


