Currently there are iPerf version 2 and 3 which are actively maintained. iPerf 3 began with the goal of rewriting the code to make it more updated and maintainable. When that happened I suspect that the maintenance of iPerf2 had stopped. However, in the last few years a new team has picked up the slack and taken ownership of iPerf 2; I am pleased to see that they are introducing new features.
The latest stable iPerf2 release for all platforms is 2.0.13. You can download the source code and executables here. If you are looking to run iPerf 2 on Linux, you have to download the code, and then compile and install it on your machine. Linux repositories currently have version 2.0.9.
There are significant improvements in the 2.0.13 release – I will review some of them in this post. It’s not an exhaustive list because I actually couldn’t find good documentation for all the new changes. I may write another blog post once I know more about them (feel free to comment on this blog post if you have anything to add!).
Client/Server Options
Some options are common when you launch the iPerf process either as a client or as a server. Here are some of the options that have changed or been added in 2.0.13:
-b, --bandwidth #[kmgKMG | pps]  bandwidth to send at in bits/sec or packets per second
-e, --enhancedreports    use enhanced reporting giving more tcp/udp and traffic information
-i, --interval  #        seconds between periodic bandwidth reports
-B, --bind <host>[:<port>][%<dev>] bind to <host>, ip addr (including multicast address) and optional port and device
Bandwidth: In earlier versions you had the option to specify the bandwidth value only on the client side and only for UDP tests. In 2.0.13 for TCP tests, the bandwidth options areis available for both the iPerf client and server. For UDP tests, you can specify the bandwidth only on the client side, since there is no connection between the client and the server.
Enhanced reports: apart from the standard bandwidth value, the “-e, –enhancedreports” option gives information about the number of packets that were written and the errors, the re-tries, the client congestion window size, round trip time, and the network power value.
Network power is a metric that was introduced by J. Jaffe, in 1979 and is defined as “the ratio of throughput over latency”. It’s a metric that attempts to characterize a network’s quality by a single value. In layman’s terms, for a given throughput, the higher the network latency, the lower the network power. On the flip side, for a given latency, the higher the throughput, the higher the network power.
netbeez.net$ ./iperf -c 172.31.0.14 -e
------------------------------------------------------------
Client connecting to 172.31.0.14, TCP port 5001 with pid 10080
Write buffer size:  128 KByte
TCP window size:  153 KByte (default)
------------------------------------------------------------
[  3] local 172.31.0.17 port 45696 connected with 172.31.0.14 port 5001 (ct=0.41 ms)
[ ID] Interval                Transfer        Bandwidth      Write/Err  Rtry       Cwnd/RTT    NetPwr
[  3] 0.00-10.01 sec   112 MBytes  94.2 Mbits/sec  899/0          0       -1K/1648 us  7146.42
Interval/Fast sampling: In previous versions the smallest reporting interval was 0.5 seconds. Now you can get down to 0.0001 seconds. This can give very fine- grain traffic pattern analysis. It can be handy when you try to analyze traffic flows that may occur for a fraction of a second.
Bind: You can now bind the test not only to a specific host, but also to a port or a device name.
Updated Server Options in the New Iperf2 Release
Here are some of the server options that have changed in iPerf 2.0.13:
-t, --time      # time in seconds to listen for new connections as well as to receive traffic (default not set)
--udp-histogram #,#  enable UDP latency histogram(s) with bin width and count, e.g. 1,1000=1(ms),1000(bins)
-B, --bind <ip>[%<dev>]  bind to multicast address and optional device
Time: you can now limit the amount of time an iPerf server is listening for connections or is receiving traffic. In previous versions you had to kill the iPerf server manually. This is particularly useful when you include iPerf in a script and you want the iPerf server to exit after a certain amount of time, instead of running for ever.
UDP Histogram: this provides additional information about the tests for UDP traffic on the server side as follows:
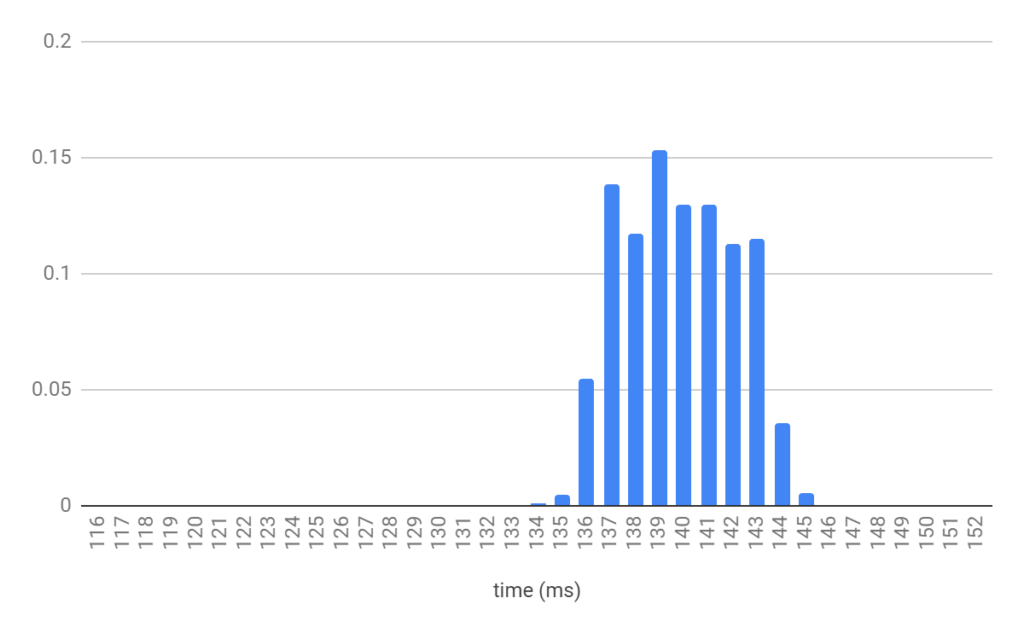
netbeez.net$ ./iperf -s --udp-histogram -u
------------------------------------------------------------
Server listening on UDP port 5001 with pid 10115
Receiving 1470 byte datagrams
UDP buffer size:  208 KByte (default)
------------------------------------------------------------
[  3] local 172.31.0.17 port 5001 connected with 172.31.0.14 port 50161
[ ID] Interval        Transfer     Bandwidth        Jitter   Lost/Total  Latency avg/min/max/stdev PPS  NetPwr
[  3] 0.00-10.01 sec  1.25 MBytes  1.05 Mbits/sec   3.933 ms    0/  893 (0%) 139.299/133.712/144.534/ 5.172 ms   89 pps  0.94
[  3] 0.00-10.01 sec T8(f)-PDF: bin(w=1ms):cnt(893)=134:1,135:4,136:49,137:124,138:105,139:137,140:116,141:116,142:101,143:103,144:32,145:5 (5.00/95.00%=136/143,Outliers=0,obl/obu=0/0)
On the first output line (0.00-10.01 sec), it gives the bandwidth, jitter, and packets, average, minimum, maximum, and standard deviation for latency, as well as packets per second and network power.
On the second line (0.00-10.01 sec) it gives the probability density function of the results. ‘w’ is the bin width, and ‘cnt’ is the total number of packets. We then see a list of all packets per bin, followed by the packets that fall in the 5% and 95% of confidence interval, the outliers, and finally the out of bound lower (obl) and out of bound upper (obu) packets.
Here is the probability plot for the packets displayed above:
Bind: You can now bind the test not only to a specific host, but also to a specific device name.
Updated Client Options in the New Iperf2 Release
Below are the client options introduced in iPerf 2.0.13 with the most significant ones being the interpacket gap and isochronous traffic which can be used to simulate video traffic.
   --ipg                Set the interpacket gap (milliseconds) for packets within an isochronous frame
      --isochronous <frames-per-second>:<mean>,<stddev> send traffic in bursts (frames - emulate video traffic)
 -V, --ipv6_domain        Set the domain to IPv6 (send packets over IPv6)
 -X, --peer-detect        Perform server version detection and version exchange
Interpacket gap: the interval between packets within a frame burst
Isochronous frames: define the frames per second together with the mean and variance of the frame bursts.
IPv6: Specify the usage of IPv6
Peer detection: ability to detect the iPerf version running of the other side of the test. Here is a sample output in which the client detected that the server is running iPerf version 2.0.13
netbeez.net$ ./iperf  -c 172.31.0.14  --peer-detect
------------------------------------------------------------
Client connecting to 172.31.0.14, TCP port 5001
TCP window size:  153 KByte (default)
------------------------------------------------------------
[  3] local 172.31.0.17 port 45734 connected with 172.31.0.14 port 5001 (peer 2.0.13)
[ ID] Interval       Transfer     Bandwidth
[  3]  0.0-10.0 sec   112 MBytes  94.2 Mbits/sec
On the other hand, if there is an older version that doesn’t support peer detection you get a message such as “(server version is old)”, this is telling you that the detection is not possible.
There seem to be more options introduced in iPerf 2.0.13, but they are not fully documented or not yet released. On the contrary, the reverse option (-R) appears in the iPerf help menu, but it’s not implemented yet. By contacting one of the iPerf contributors, I was told that this option might be released in the next couple of months. It’s particularly useful when you need to run an iPerf test with a host that’s behind a NAT or a firewall.
It looks like iPerf 2 has a strong team of developers that keep improving the tool and adding more options for network performance measurement and testing. I am looking forward to upcoming releases.