The public dashboard, or more formally, the Network Status Dashboard, is one of the features that we rolled out with our most recent release. This dashboard, which you can easily deploy on a web host or intranet alongside your NetBeez installation, gives you a way to share network status data with colleagues, your customers, or even the public. We think this will be a handy addition to the overall NetBeez monitoring solution.
One of the motivations behind this public network status dashboard was to showcase our new API, which enables NetBeez users to access NetBeez monitoring data outside of the main application, and to display data in new and different ways. We’re sure the API can be useful for tasks such as generating reports, integrating NetBeez data with other tools, and sharing information about your network with a broader audience. In addition to serving as an invaluable network monitoring tool, we developed the public dashboard to also serve as a template or jumping-off point for developing your own widgets and applications using the NetBeez API.
Our goal was to create something that was simple, accessible, and that users could easily expand and customize. I’ll walk you through some of the aspects of the public dashboard and explain how it works, and also go into detail about how it works under the hood and hopefully provide some ideas for creating your own applications.
Check out the public dashboard on GitHub: https://github.com/netbeez/public-dashboard. You can grab the files and see setup and configuration instructions.
Network Status Dashboard Features
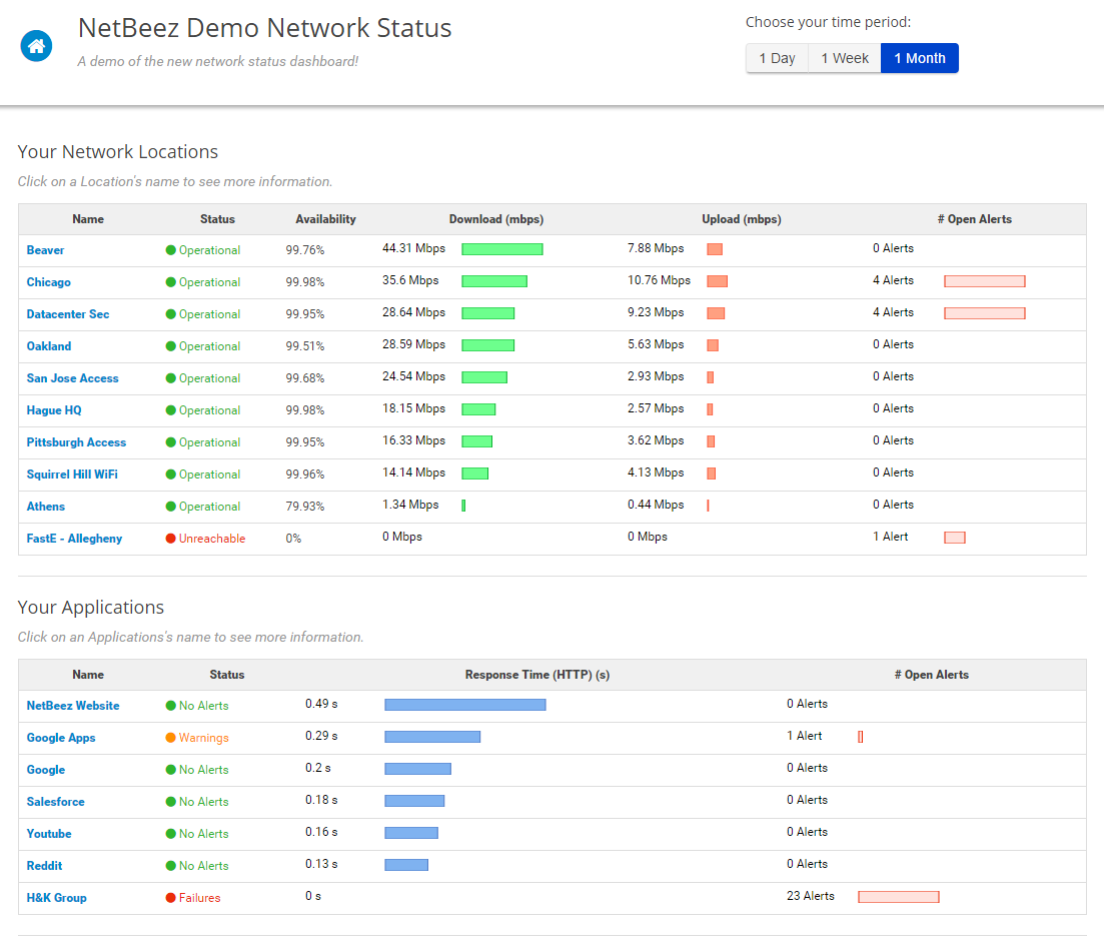
The public dashboard displays your network monitoring data in a simple, visual format that’s easy for laypeople to understand. Agents and targets are presented as locations and applications and are shown in sortable tables with information on status, upload and download speeds on agents, and HTTP response time for targets.
Dashboard Timelines
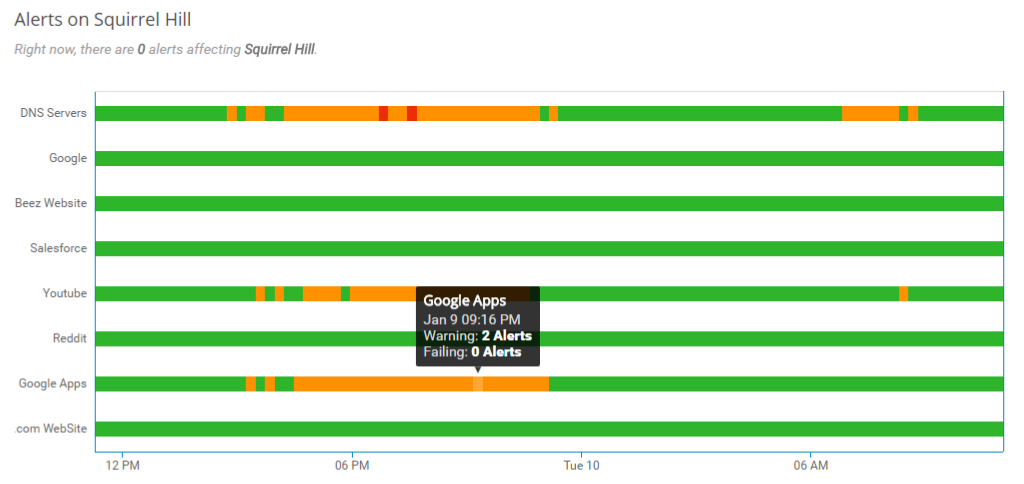
We’ve introduced alert timeline graphs on the pages for individual agents/targets. These visualizations show the status of alerts between a given agent and target over a period of time. This gives quick visual insight into how each application is performing in relation to the selected agent and vice versa, and reveals patterns in performance over time and across different elements on the network.
Agents Status Dashboard
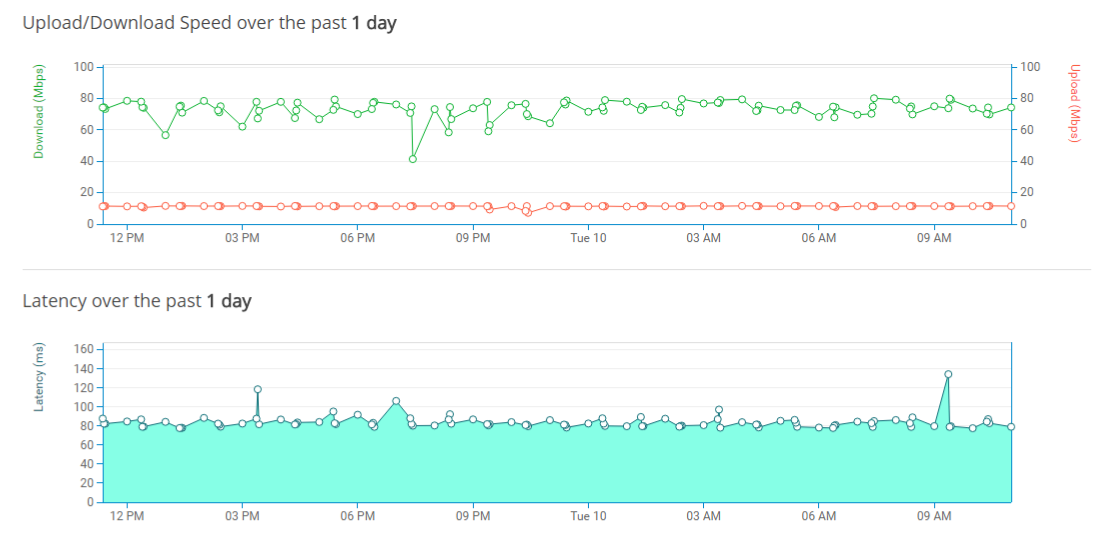
For agents, you can also view information on upload and download speed as well as latency. This information is pulled from the scheduled test data. For agents that not associated with a scheduled speed test, these graphs will be blank. In future versions of the public dashboard and API, we’ll be improving control over which of your agents and targets are displayed on the public dashboard.
For targets, there is the HTTP response time graph, which shows a bar graph of the average per-agent response time over the selected time period and a line graph showing the aggregate average of HTTP response time for that target over time.
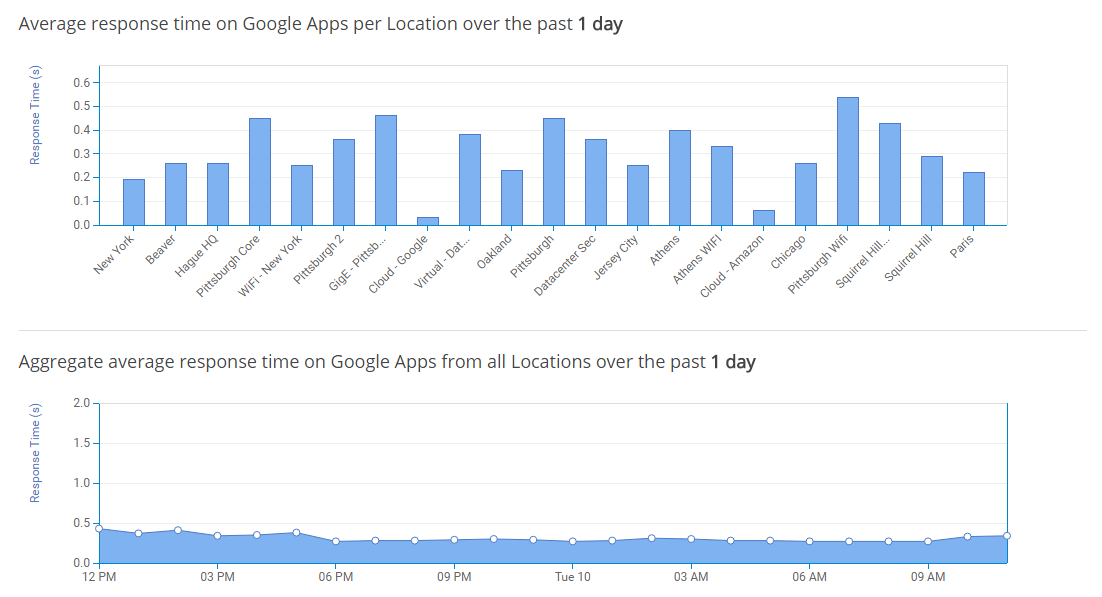
You can check out a demo of the public dashboard here: http://public.netbeezcloud.net/
Configuring the Network Status Dashboard
The public dashboard is a fairly simple PHP site that we hope will be accessible and easy to work with.
To hook your new status dashboard up to your NetBeez instance, all you need to do is enter your information into the config.php file. This file essentially serves as the admin panel where you change your settings. If you don’t plan on making any customizations or additions to your public dashboard, this will be the only PHP file (and probably the only file) you have to touch.
//The host address of the NetBeez API (this is usually your NB dashboard's hostname)
define("API_HOST", "<YOUR_NETBEEZ_HOSTNAME>");

//The NetBeez API version
define("API_VERSION", "v1");

//Your authentication key for accessing the API
define("API_AUTH_KEY", "XXXXXXXXXXXXXXXXXXXXXXXXXXXXXXXXXXXXXXXX");
Using Data from the API
The public dashboard uses a collection of classes to access and return the JSON endpoint data from the NetBeez API as objects that can be manipulated by other functions and used in visualizations. The Api_Access class and the child classes for each category of endpoints (at least those endpoints used by the public dashboard) handle fetching the data and returning it as an object.
protected static function make_get_request($url_array, $queries_hash = array()){
    //prepare to make the request
    $url = self::build_url($url_array, $queries_hash);

    //make the request
    $ch = curl_init(); 	                                                //open curl
    curl_setopt($ch, CURLOPT_URL, $url);                                // Set so curl_exec returns the result rather than outputs it.
    curl_setopt($ch, CURLOPT_RETURNTRANSFER, true);
    curl_setopt($ch, CURLOPT_HTTPHEADER, self::required_headers()); 	// set headers
    curl_setopt($ch, CURLOPT_SSL_VERIFYHOST, SSL_VERIFY_HOST);
    curl_setopt($ch, CURLOPT_SSL_VERIFYPEER, SSL_VERIFY_PEER);
    curl_setopt($ch, CURLOPT_VERBOSE, true);
    curl_setopt($ch, CURLOPT_CONNECTTIMEOUT, 60);
    curl_setopt($ch, CURLOPT_TIMEOUT, 60);
    $response = curl_exec($ch);		                                //make the request

    $curl_errno = curl_errno($ch);
    $curl_error = curl_error($ch);
    if ($curl_errno > 0) {
        echo "cURL Error ($curl_errno): $curl_error";
    }
    curl_close($ch); 	//close curl

    return $response;
}
The above function sends the request to the API. It’s inherited by all the endpoint child classes. Note the global variables from the config file.
// ******************************************************************
// SCHEDULED NB TEST RESULTS
// ******************************************************************
class Scheduled_Nb_Test_Results extends Api_Access {
    // URL: <host>/scheduled_nb_test_results(.*).json
    // only index and show (inherited)

    public static function index($from, $to, $agent_id, $test_type_id, $group_all_results){
        // URL: <host>/<base_class>.json
        // create the URL array
        // the host and namespace (agents) is automatic
        $queries_hash = array('from' => $from, 'to' => $to, 'agent_id' => $agent_id, 'test_type_id' => $test_type_id, 'group_all_results' => $group_all_results);
        $url = array();
        $response = self::make_get_request($url, $queries_hash); //make the request
        return $response;
    }
}
The class for handling the scheduled test results endpoint.
Please note that the API access classes in the public dashboard do not cover all available endpoints, only the ones that are utilized by the public dashboard. In the near future, we plan to release code for all endpoints.
Now that we’ve taken care of fetching and returning data from the API, we need to process the data so that we can use it in data visualizations and other displays of information We process and associate the data in associate_api_data.php. Here’s one of those functions:
public static function build_agent_graphs_data_object($time_window, $agent_id){

    $current_time = new DateTime();
    $to = $current_time->getTimestamp() * 1000;
    $from = $to - $time_window;

    $agent_data = json_decode(Scheduled_Nb_Test_Results::index($from, $to, $agent_id, 7, 0));
    $agent_data = $agent_data->{'nb_test_results'};

    $agent_data_object = array();

    for($i = 0; $i < count($agent_data); $i++){

        if(!empty($agent_data)){
            $sched_results = $agent_data[$i]->{'result_values'};

            $download_speed = round($sched_results[0]->{'value'}, 2);
            $latency = round($sched_results[1]->{'value'}, 2);
            $upload_speed = round($sched_results[2]->{'value'}, 2);
        } else {
            $download_speed = 0;
            $latency = 0;
            $upload_speed = 0;
        }

        $test_run = array(
            "ts" => $agent_data[$i]->{'ts'},
            "down" => $download_speed,
            "latency" => $latency,
            "up" => $upload_speed
        );

        array_push($agent_data_object, $test_run);
    }

    return json_encode($agent_data_object);
}
This function fetches and formats data for the upload/download speed and latency graphs on the agent view and returns a JSON object that can be used by the JavaScript code. Other functions involve pulling data from multiple endpoints to reveal new views and associations.
Templates and Styles
The public dashboard is made up of dynamic templates, which display the required layout and components. The templates, which you can find on NetBeez github page, are written predominantly in HTML, making them easy to understand and edit. I’ve made sure to keep templates free of logic so you can modify templates easily without losing or breaking functionality.
In terms of styling, I’ve kept the look and feel of the public dashboard deliberately neutral and bland. This is so that you can customize or overwrite the stylesheet to match your own branding without my design vision getting in your way.
Customizing the Dashboard
We hope that the public dashboard work as a springboard and inspiration for your own additions and new dashboards. The public dashboard doesn’t include everything (and isn’t supposed to), but if you want to see new visualizations and don’t want to wait on us, fork the public dashboard from GitHub and have at it.
For those of you who’d like to make custom visualizations but don’t have a background in d3.js (the data visualization library we use for NetBeez as well as the public dashboard), I recommend trying out dimple.js. Dimple is built on d3 and is designed to be easy to use and learn.
Conclusion
We hope to keep improving the public dashboard to better meet your needs. A big item on our to-do list is to better optimize both the dashboard and API for speed, especially for when you’re working with large NetBeez installations.
Feel free to contribute to the public dashboard on GitHub or use the API to create your own widget or dashboard.
In the near future, I’m interested in using our API to develop new visualization concepts that I can share with the greater community. Currently, I’m looking into creating a status dashboard for wireless access points, which I think might be of interest to some of you.
Overall, I think the public API is a great way to explore the data and come up with new ways to display and communicate it, and the public dashboard is a good first step.


