 This week we’ve pushed a new software release of the BeezKeeper, which introduces two major features our users have long awaited:
- The NetBeez RESTful API: a way for users to create their own dashboard or integrations
- The NetBeez public dashboard: a status page that can be hosted on a public intranet or Internet site that shows information about the network locations and applications monitored by the sensors.
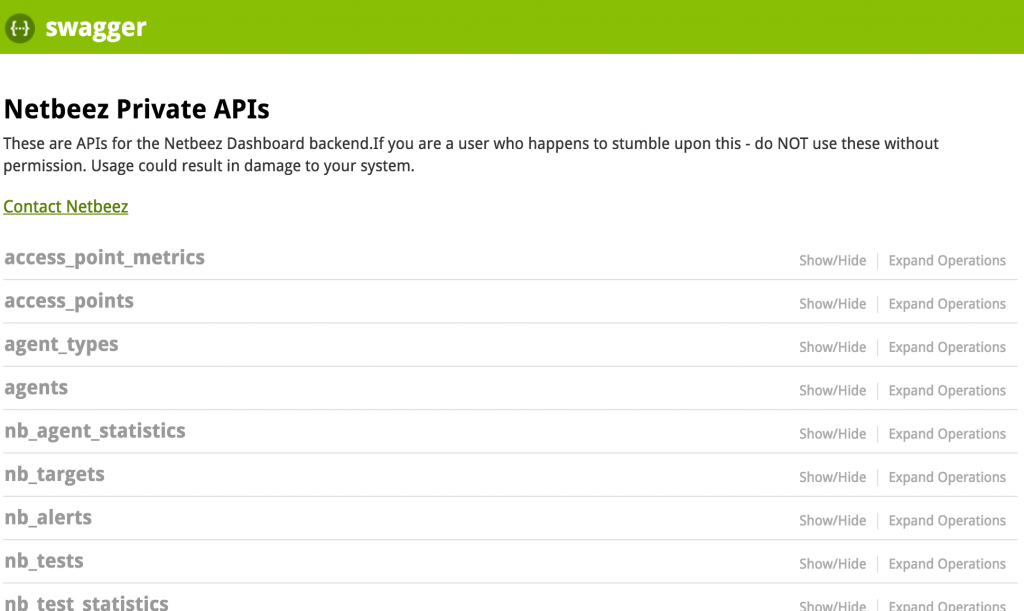
Thanks to the API, you can build your own customizations and integrations with NetBeez. The current version of the API only supports GET calls. That means that you will only be able to obtain information about the resources managed by NetBeez, like agents, targets, and tests, without creating new ones or changing existing ones. In the future, we will start adding POST calls to enable also this type of interaction and expand the applications and use cases of the API. If you are interested in learning more, here is the link to the API documentation. Stay tuned – next week our CTO, Panickos, will publish a post that explains how to use the API in more detail, providing real examples.
Another unmet need NetBeez users had before this release was the ability to share NetBeez monitoring data and network status with a broader audience, like company employees and customers. With the new release, anyone with average programming skills can build a network/service status page with the NetBeez API. To get things rolling, Allison, our UI/UX developer, has developed a simple public dashboard in PHP that can be hosted on any Intranet site or web host that runs PHP (just make sure to enable the PHP cURL extension). If you have a NetBeez dashboard running, you can download the public dashboard files from our GitHub repository, create an API key, configure the site, and get it up and running in minutes. If you don’t have a NetBeez dashboard, you can request a 15-day trial.
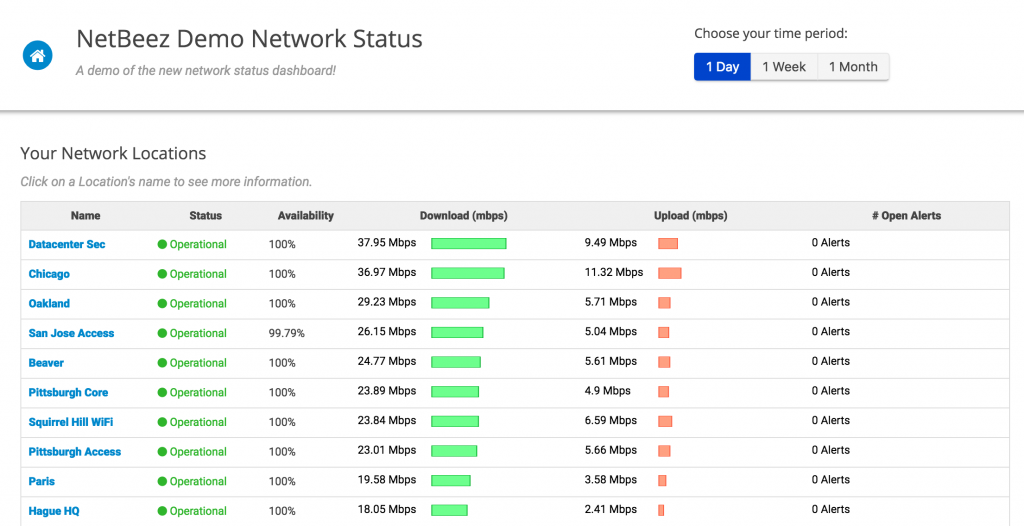
On the homepage of the public dashboard, you can quickly review the status of agents, which represent the status of the network locations where they are installed, in a sortable table:
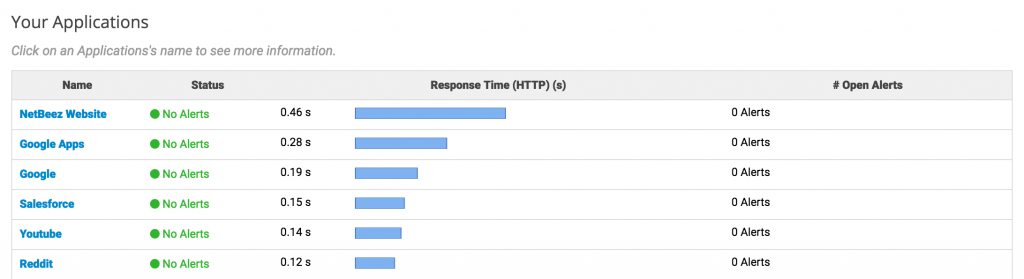
… and of the configured targets, which represent the status of the applications monitored by the agents:
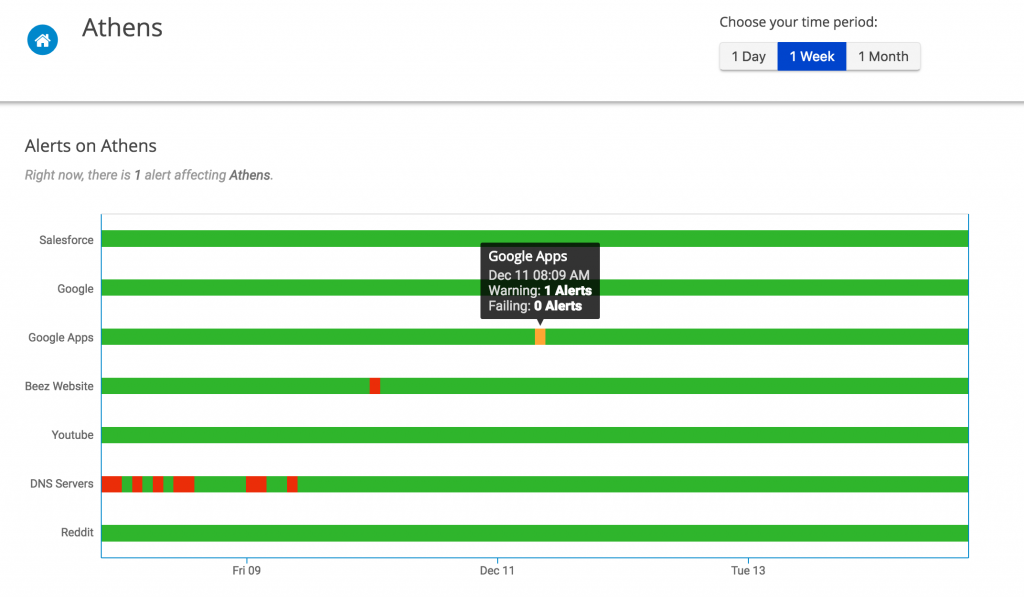
If you need historical information about your network locations and application, the dashboard also includes a drill down view. For example, if you click on the Athens agent, you can see the real-time and historical status of the applications monitored by the network sensor installed at that location:
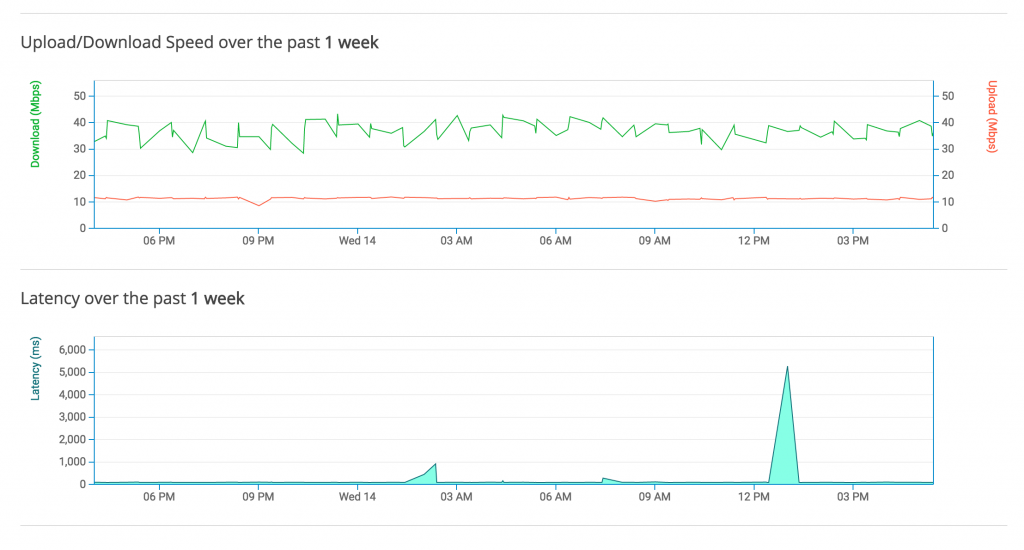
You can also view speed test information with Internet download and upload speed:
In January, Allison will publish a post that will provide more information and insights on how to use and contribute to the public dashboard, as it’s released under the Apache license. Once again, I’ll share the link to the project’s GitHub project.
On top of the two new features that I just mentioned, the new version of the BeezKeeper introduces many improvements that are mostly under the hood. So while these improvements are not visible on the surface, they bring great performance improvements to browsing the dashboard. The most important improvement is the implementation of a server-side cache of the dashboard that reduces the loading time and improves responsiveness, especially for those installations that manage hundreds of agents.
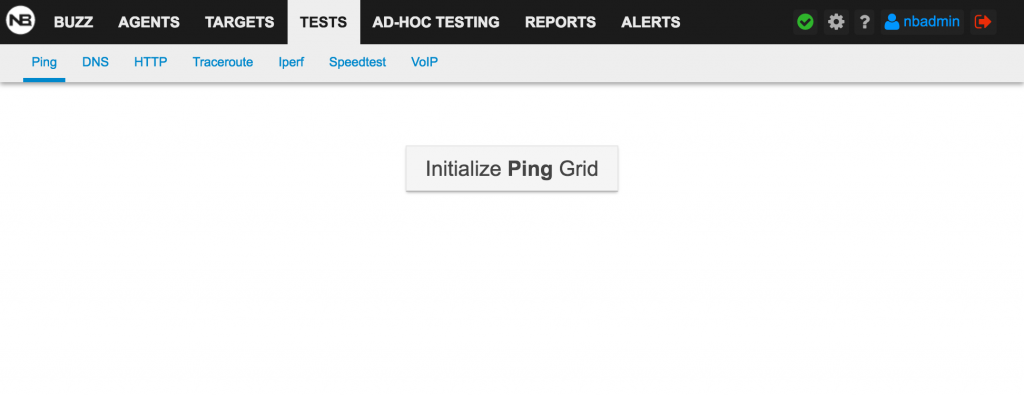
One of the more visible performance improvements is holding off on loading huge, data-heavy visualizations you may or may not need to look at. You will notice that the grid views are not automatically loaded – you can click the initialize button to load the grid.
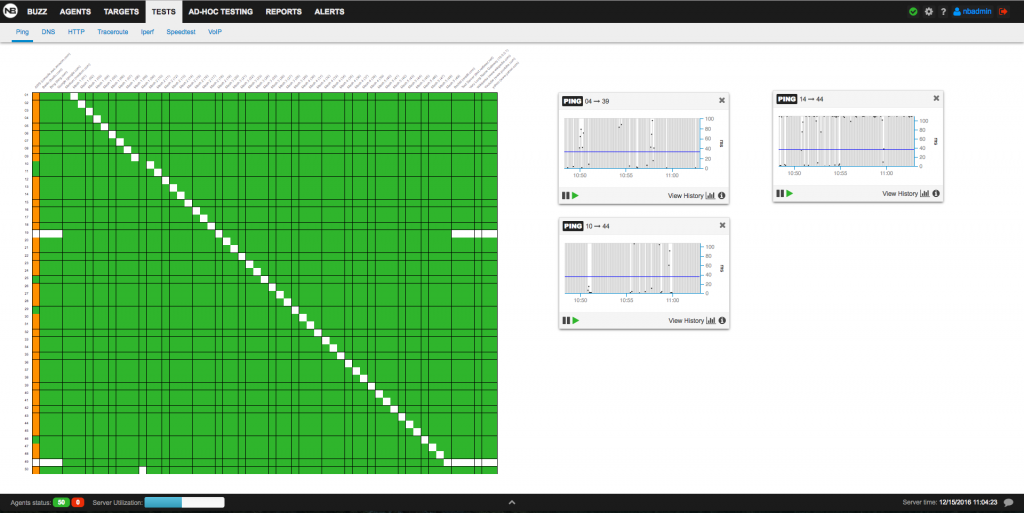
We also enabled zooming for the grid view. Before this release, the gridview had a fixed size, limiting the amount of tests that could be reviewed at a glance. This is something that NOC operators appreciate because it gives them the opportunity to fit a large grid view into their screens. In the screenshot below , you can see that I have zoomed out on a grid that reports tests from 50 different agents pinging 60+ targets. It’s a good way to have a bird’s eye view on your network and quickly spot performance issues like the one represented by the orange column.
We’ve also improved the algorithm that manages scheduled tests like Iperf, SpeedTest, or VoIP. By implementing queues, we are able to better manage conflicting tests that use the same agents and are scheduled at the same time.
The last major improvement is on the WiFI side. In the agent view, we introduced an indicator of the wireless signal strength …
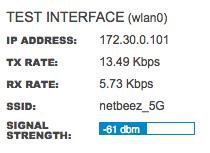
.. and also updated the WiFI sensor to use the Linux command iw to get information about the wireless strength from the WiFi network adapter.
We hope that you will like the new update and the features and improvements that the development team put together. I would love to hear your feedback about this new release. Please don’t hesitate to request a one-to-one demo.