Introduction: Moving Beyond Basic Benchmarking
For network engineers, relying solely on basic single-stream iPerf or simple ping output often fails to capture the true performance characteristics of a network path, especially under load. This is where FLENT (The FLExible Network Tester) comes in.
FLENT isn’t just another speed test; it’s a robust Python-based wrapper around established tools like netperf and iPerf. Its core value lies in its ability to automate the execution of complex, predefined test scenarios (like concurrent upload/download streams), aggregate the resulting raw data from multiple metrics (throughput, latency, jitter), and generate detailed, publication-quality plots.
While FLENT is primarily known in the open-source community for its effectiveness in detecting and quantifying bufferbloat, it serves as an indispensable tool for deep-dive network diagnostics. The output isn’t just an average number; it’s an aggregated, time-series data set, saved in a portable JSON format, ready for immediate plotting or integration into other analysis pipelines.
Installation and Platform Dependencies
FLENT is highly cross-platform, but it relies on several key dependencies to function correctly, particularly if you require graphical plotting.
Prerequisites
- Python: FLENT requires Python 2.7+ or 3.3+.
- netperf: This is the primary engine for most tests. You must use version 2.6 or higher, compiled with the –enable-demo option.
- matplotlib: Required for generating the standard, high-quality plots (.png, .pdf, .svg).
- Utility Tools: For accurate latency measurement, the system’s ping must support output timestamping (-D). If not, FLENT will prioritize the use of the fping utility (v3.5+). The irtt tool is also highly recommended for precise UDP measurements.
Supported Platforms and Installation
Installation is straightforward across major operating systems, often leveraging platform-specific package managers:
| Platform | Installation Method |
| Debian/Ubuntu | apt install flent |
| Fedora | dnf install flent |
| General Linux/Other | pip install flent |
| macOS (via Homebrew) | Requires installation of patched netperf-enable-demo package via Homebrew, followed by pip3 install matplotlib flent –user. |
Export to Sheets
Essential Usage Examples
All FLENT tests require a two-computer setup: a Server and a Client. The Client runs the flent command, which orchestrates the tests against the Server, which must be running netserver.
Server Setup
On your target server (e.g., a local device), start the netperf daemon:
netserver &
In their documentation they list a few public netperf servers that can be used with flent:
- netperf.bufferbloat.net (also called netperf-east.bufferbloat.net)
- netperf-west.bufferbloat.net
- netperf-eu.bufferbloat.net
At the time of writing only the second and third appeared to be functional. However, one of the main benefits of flent (similar to iPerf) is that you can run network performance testing by controlling both the client and server (unlike public Internet speedtest services such as https://speed.cloudflare.com/)
Client Commands
The core flent commands are structured: flent <test_suite> -l <duration> -H <server_address> -o <filename.png>
1. The Standard Bufferbloat Test (RRUL)
The RRUL (Reroute, Reroute, Upload, Latency) test is the benchmark for diagnosing congestion. It runs TCP download, TCP upload, and several parallel TCP flows simultaneously with ICMP pings to measure the effects of load on latency.
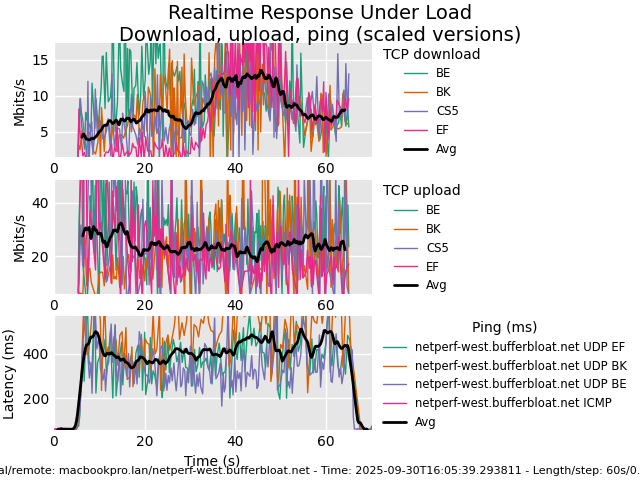
flent rrul -p all_scaled -l 60 -H <SERVER_IP> -o my_rru_test.pngHere is what the plot looks like running the following on my MacOS laptop:
flent rrul -p all_scaled -l 60 -H netperf-west.bufferbloat.net -o flent_rrul_all_scaled-west.png
2. Latency Probability (CDF Plot)
To analyze the stability of latency, particularly the probability of ping times remaining below a specific threshold, use the Cumulative Distribution Function (CDF) plot preset:
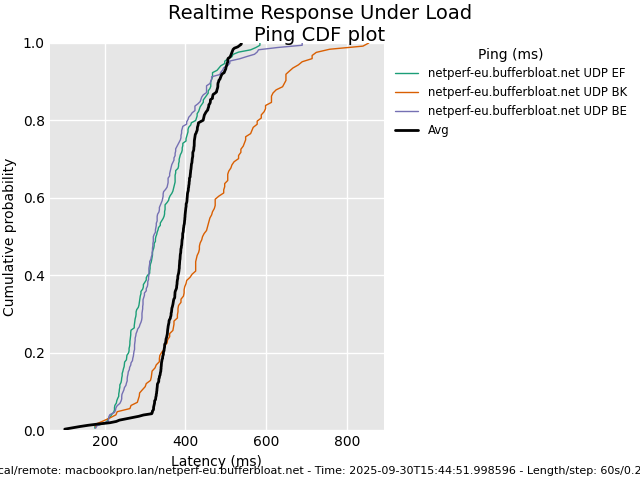
flent rrul -p ping_cdf -l 60 -H <SERVER_IP> -o latency_cdf.pngHere is what the plot looks like running the following on my MacOS laptop:
flent rrul -p ping_cdf -l 60 -H netperf-eu.bufferbloat.net -o flent_rrl_ping_cdf-eu.png
3. Single-Direction Throughput Test
For a quick but comprehensive view of a single flow direction’s performance and its associated latency:
flent tcp_download -p totals -l 30 -H <SERVER_IP> -o tcp_download_results.png
Visualizing Performance: Key FLENT Plots
FLENT’s strength lies in its ability to automatically generate complex visualizations directly from the raw data, eliminating the need for post-processing in spreadsheets.
The Standard RRUL Plot (all_scaled)
This is the most common output when diagnosing congestion. The plot typically consists of three synchronized time-series charts, allowing engineers to correlate events:
- Download Throughput: Shows the TCP download rate over time.
- Upload Throughput: Shows the TCP upload rate over time.
- Latency: This critical third chart shows the concurrent ping latency. By viewing the spikes in latency (vertical axis) precisely when throughput is at its maximum (horizontal axis), you can visually quantify the impact of congestion on the user experience.
Cumulative Distribution Function (CDF) Plot (ping_cdf)
The CDF plot is highly valuable for SLA/SLO assessment. This plot shows the probability that your measured latency will be less than a certain value. A sharp curve indicates a high-performance, stable network, while a shallow curve indicates a highly variable and unpredictable latency profile.
Conclusion: FLENT vs. the Alternatives
FLENT distinguishes itself from other popular network testing tools by focusing on comprehensive, congested-state analysis, rather than just raw maximum bandwidth.
iPerf/iPerf3 are excellent, indispensable tools for measuring the maximum achievable throughput of a connection but are primarily designed for single-metric, single-test-type execution. They lack the built-in orchestration to run diverse, parallel load patterns while simultaneously monitoring critical metrics like latency from an independent source.
Similarly, consumer-grade platforms, such as the Cloudflare Speed Test, provide a fast number, but often use highly optimized streams that can easily mask the true performance impact of bufferbloat. As discussed in the NetBeez article, “Mach Speed Test: The Ultimate Speed Test”, relying solely on the peak speed often fails to capture the latency and consistency issues that degrade user experience. FLENT, by contrast, is a testing framework. It leverages the performance engines (netperf, iperf) to run intricate, repeatable, multi-metric test profiles (like the RRUL suite), force congestion, aggregate the output, and automatically provide the visual correlation between load and latency. For network professionals whose job requires deep-dive analysis and objective characterization of network behavior under realistic stress, FLENT provides the necessary rigor and detail.


