NetBeez is a Wireless Network Monitoring Tool that provides real-time and historical WLAN performance data from the client perspective. Included in version 1.4 of NetBeez, the Wi-Fi tab is a workspace dedicated to retrieving and displaying Wi-Fi metrics at scale.
In Wi-Fi tab, the wireless administrator defines what WLAN networks the NetBeez Wi-Fi sensors actively monitor. As soon as the user defines the SSID and assigns them to the sensors, the dashboard returns the status and performance measurements. The following picture displays one NetBeez Wi-Fi beez:
Wireless Network Performance Metrics
For each WLAN SSID configured, the NetBeez wireless network monitoring tool providers the following Wi-Fi performance metrics:
- Link Quality (%) – Represents the percentage of successfully transmitted and received data packets over the wireless connection, indicating the overall reliability of the link.
- Signal Strength (dBm) – Measures the power level of the received signal in decibels (dbm), indicating the strength or intensity of the Wi-Fi signal.
- Bit Rate (Mbps) – Indicates the data transfer rate in megabits per second (mbps) between the agent and the Wi-Fi network, reflecting the speed of data transmission.
- Channel – Specifies the communication frequency channel on which the wireless connection operates, helping to avoid interference and optimize network performance.
- BSSID (MAC) – NetBeez sensors report the MAC address of the Wireless Access Point they connect to.
- Interface speed (bps) – The real-time bps transmitted and received on the Wi-Fi interface of the sensor.
In the following screenshot we display in real-time the metrics collected by one NetBeez Wi-Fi sensor:
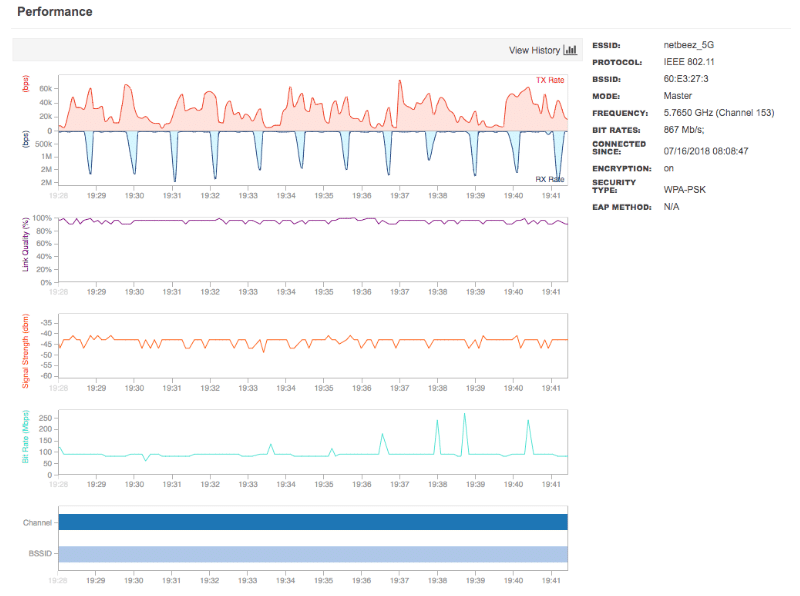
The NetBeez dashboard plots wireless data in real-time for quick detection and analysis. The user can also decide for how long this data will be saved for historical analysis.
The Wireless Network Monitoring Dashboard
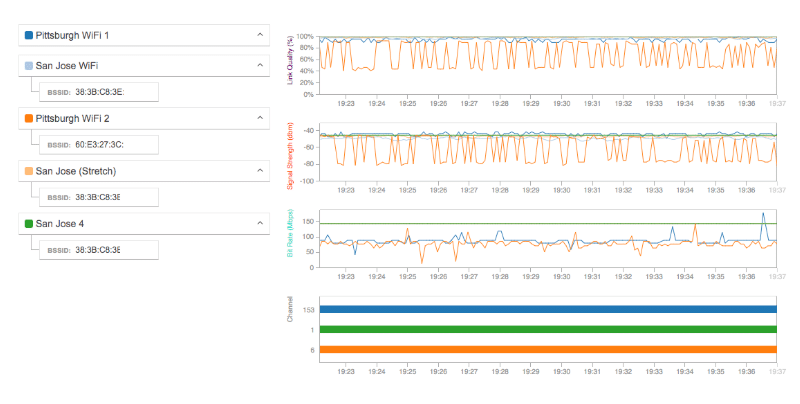
NetBeez makes it easy to monitor large enterprise WLAN deployments. The NetBeez dashboard aggregates wireless performance metrics from several NetBeez network monitoring sensors on a per-SSID basis. This visualization makes it easy to compare performance metrics from multiple monitoring sensors when troubleshooting Wi-Fi performance issues. In the following screenshot, wireless metrics from five different sensors are overlapped to identify what areas are under-performing.
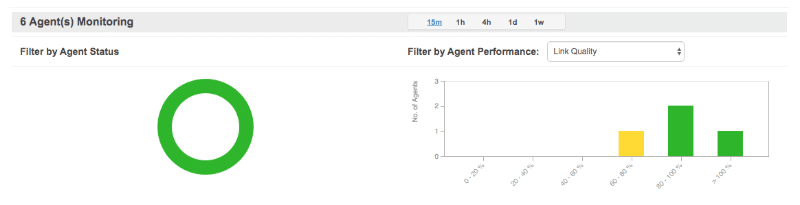
Let’s imagine that you have 50 Wi-Fi sensors deployed in different areas of an enterprise network. In the Wi-Fi tab, users can see the performance of each sensor highlighted in a bar chart that groups sensors, based on signal strength, link quality, and bit rate, with similar performance. The goal of this section is, for example, to quickly identify the Wi-Fi sensors that have weak signal strength and poor link quality.
Proactive Alerting on Wireless Networks
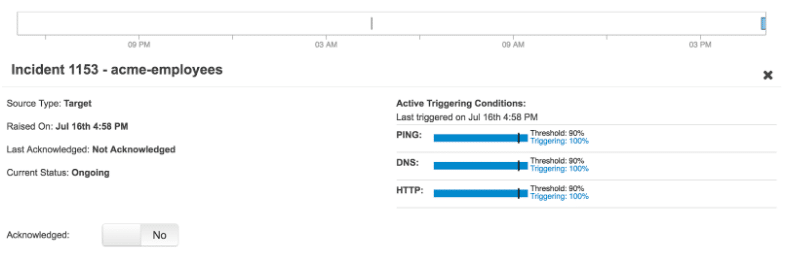
NetBeez support proactive alerting via Wi-Fi incidents. Wi-Fi incidents are configured by setting thresholds for each test type (ping, DNS, HTTP, and traceroute). Each threshold specifies the percentage of tests deemed necessary to trigger alerts and open a Wi-Fi incident.
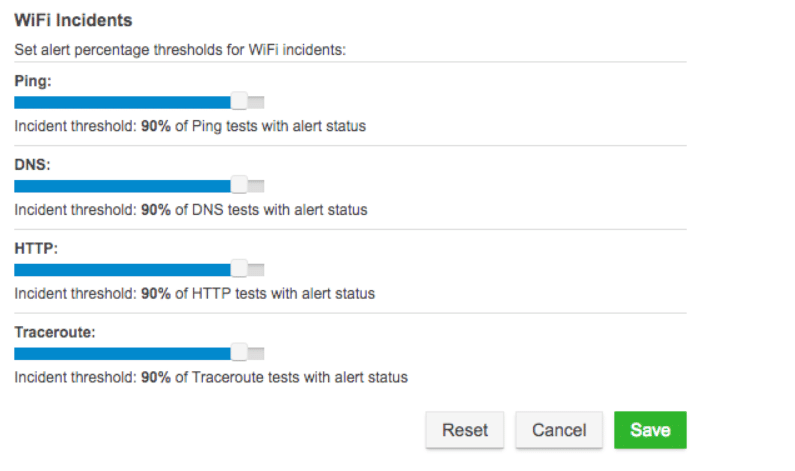
Let’s suppose that you have the ping threshold set to 90% and that each of the 50 Wi-Fi sensors monitoring a specific SSID is running 2 ping tests. In this scenario, there are a total of 100 ping tests. In this specific case, the system opens a Wi-Fi incident when 90 or more ping tests trigger a performance alert.
Wireless Network Speed Test
The NetBeez sensors can also run iperf, network speed, and VoIP measurements. These tests can either run in ad-hoc mode or by creating a scheduled test. Ad-hoc testing provides an efficient method to quickly verify Internet speed or Voice-over-IP performance between any two agents managed by the dashboard.
As a network speed test option, NetBeez supports two types of tests:
- NDT – As I originally covered in a previous blog post about NDT, this test runs a download and upload speed test very similar to the Ookla one, but to a different set of servers sponsored by the measurement lab (M-Lab). It’s a good alternative to the existing Ookla speedtest.
- Fast.com – Is a download speed to the NetFlix CDN network to verify the performance of NetFlix streaming. This feature is particularly useful to Internet Service Providers interested in measuring the home subscriber end-user experience.
Closing Remarks on NetBeez Wireless Network Monitoring Tool
NetBeez is a Wireless Network Monitoring Tool that provides real-time and historical WLAN performance data. Featuring a dedicated Wi-Fi tab, administrators can actively monitor specific WLAN networks by assigning SSIDs to sensors, receiving status updates, and accessing diverse performance metrics like link quality, signal strength, bit rate, channel, BSSID, and interface speed. The dashboard offers real-time data visualization for immediate analysis and permits data retention for historical assessment. It also facilitates proactive alerting through Wi-Fi incidents, triggered by configurable test thresholds. Additionally, NetBeez sensors conduct network speed tests, utilizing tools like NDT and Fast.com, to gauge download/upload speeds and streaming performance, enhancing insights into network functionality. Request a demo or a web trial to learn more about it.