Intro to SNMP
SNMP (Simple Network Management Protocol) is an Internet Standard that defines how to query network devices, such as routers and switches. The information requested via SNMP typically relates to the status of various resources within a device. Resources are, for example, the CPU utilization, memory consumption, and network interfaces. What specific information you can get from a particular device depends on the manufacturer and the model of that device. Manufacturers create sets of files called management information base (MIB) files that outline what you can ask from specific devices. Most network monitoring tools have a predefined set of standards SNMP MIB. The network administrator can also import vendor specific MIB files into a Network Management System (NMS).
The following is the snippet of the CISCO-BGP4-MIB.my for the Cisco ISR 1000 router.
cbgpRouteTable OBJECT-TYPE
    SYNTAX          SEQUENCE OF CbgpRouteEntry
    MAX-ACCESS      not-accessible
    STATUS          current
    DESCRIPTION
        "This table contains information about routes to
        destination networks from all BGP4 peers.  Since
        BGP4 can carry routes for multiple Network Layer
        protocols, this table has the Address Family
        Identifier(AFI) of the Network Layer protocol as the
        first index. Further for a given AFI, routes carried
        by BGP4 are distinguished based on Subsequent Address
        Family Identifiers(SAFI).  Hence that is used as the
        second index.  Conceptually there is a separate Loc-RIB
        maintained by the BGP speaker for each combination of
        AFI and SAFI supported by it."
    REFERENCE
        "RFC-1771: A Border Gateway Protocol 4 (BGP-4),
         RFC-2858: Multiprotocol Extensions for BGP-4,
         RFC-2547: BGP/MPLS VPNs"
    ::= { cbgpRoute 1 }
SNMP Architecture
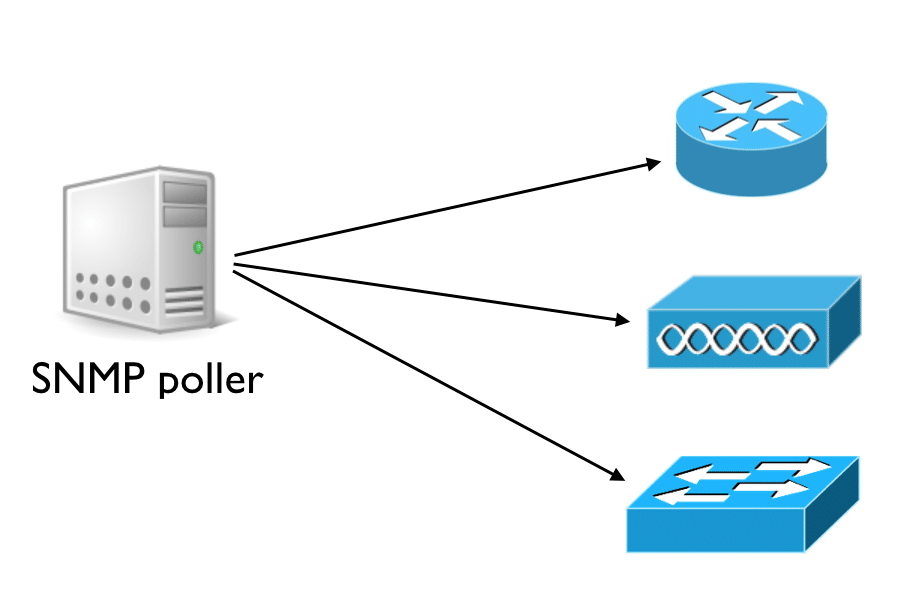
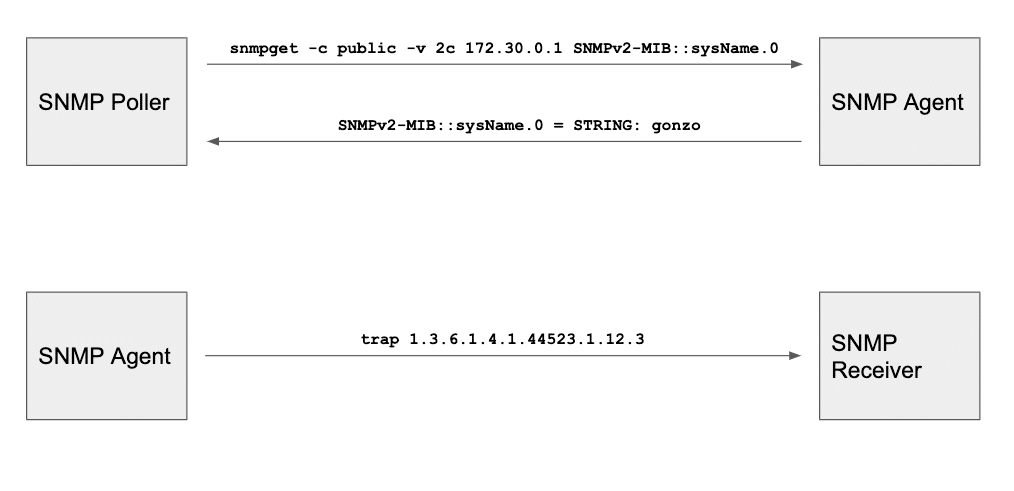
The protocol relies on a software agent on each monitored device, responding to queries from a network management server (NMS). The NMS, also known as an SNMP poller, regularly requests resource utilization values from each device to verify its status. If the agent reports values exceeding an administrator-set threshold, the server generates an alert for the network administrator.

An SNMP agent utilizes UDP port 161 to accept requests from a poller. SNMP can also be used to configure devices. If needed, it can send alerts, called traps, to an SNMP trap receiver. These traps are triggered when an event requiring administrative attention occurs on the device itself. An SNMP trap might be triggered, for instance, when a router’s network interface goes offline. By default, an SNMP agent sends traps using UDP to port 162.

SNMP Limits
The function of SNMP tools is to detect about unavailability and performance degradation issues of network devices. In fact, these are events that negatively affect the status and performance of network services. However, while knowing the status of network devices is necessary, it’s not sufficient to verify the availability and performance of user facing network services. SNMP monitoring tools can tell you if a router or switch is working. On the other end, it can’t tell you if users are having connectivity or performance issues to SaaS applications.
Adding the End-User Perspective to Network Monitoring
Network monitoring with SNMP is not enough to capture the end-user perspective. SNMP tools should be complemented by a set of dedicated sensors that perform active end-to-end performance tests. These agents runs performance and availability tests against SaaS applications, breaking down performance from the network, to the DNS, and HTTP layer. These tests are used to verify that users are having a good experience with the network and application. This is the goal of NetBeez. NetBeez relies on hardware (Ethernet and WiFi) and software sensors that are configured to continuously perform tests like ICMP, DNS, HTTP, and Traceroute. These tests can detect end-user experience issues derived by network and application degradation like packet loss, increased network latency, increased DNS and HTTP response time.
| Test | Type of Information |
| PING | Round-trip-time, packet loss, host unreacheable |
| DNS | DNS query time, DNS failure rate, DNS service down |
| HTTP | GET time, GET failure rate, web server unavailable and other HTTP error codes |
| Speedtest | Download speed, upload speed |
| Iperf | TCP/UDP throughput, packet loss, jitter |
Network Monitoring Sensors Location
An important factor of active monitoring tools like NetBeez is the location of the sensors. When implementing a distributed network monitoring monitoring solution, you should have enough observation points to get a complete view of the network. Each network location where there are users (e.g. offices) or applications (e.g. data centers), should include one or more sensors. To deploy sensors in a Wide Area Network (WAN), you can use single-board computers like the Raspberry Pi. These platforms are also useful to monitor wireless networks, which are intrinsically more challenging to monitor and support than wired networks. On the other side, if you need to monitor a set of applications in a data center, the monitoring sensors can be provisioned as virtual appliances or software containers.
Network Type | Sensor Options |
| Remote office location | Single-board computer, virtual appliance, dedicated workstation with software package, … |
| Data center or cloud | OVA, KVM, Docker, … |
| WLANs | Wireless sensors |


