In large wide area networks with dozens, or even hundreds, of remote sites, appropriate network monitoring configuration must be in place to assure that the network administrator can receive prompt notification of outages that impact users.

Traditionally, network monitoring was implemented with tools that were based on protocols like SNMP and NetFlow. These protocols are still effective in assessing the status of network devices’ availability and resource consumption. However, SNMP and NetFlow applications provide very little information about the end users’ connectivity and the service availability of cloud and internal applications.
| Tools type | Primary use |
| SNMP | Network devices’ up-down status and resource consumption |
| NetFlow | Bandwidth consumption |
| Active | Network connectivity and service availability |
Network Monitoring Sensors Tests
The increasing number of SaaS applications that are hosted in the cloud is requiring a new set of network monitoring tools to be adopted by the network administrator. In contrast to SNMP and NetFlow, active monitoring tools are based on continuous monitoring via end-to-end tests. By running network and application tests at regular intervals, the network administrator can rely on real-time and historical data to proactively monitor connectivity and service availability.
| Type of test | Data returned |
| ping and traceroute | Latency, packet loss, routing information, reachability |
| DNS | DNS service availability and query time |
| HTTP | HTTP service availability and response time |
| Iperf | TCP and UDP speed (including multicast) |
| speedtest | Download and upload Internet speed |
Network Monitoring Sensors Location
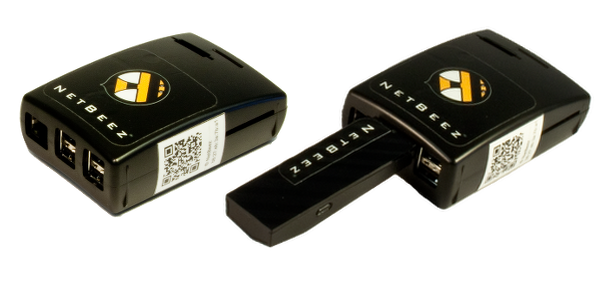
In active network monitoring, the location of the sensor is very important. In multi-site enterprises, the network administrator can deploy one sensor at each site, what we call distributed network monitoring. Distributed network monitoring has two primary benefits: first, it assures that every site of the network is appropriately monitored and second, it empowers the network administrator with complete information to quickly differentiate network from application issues.

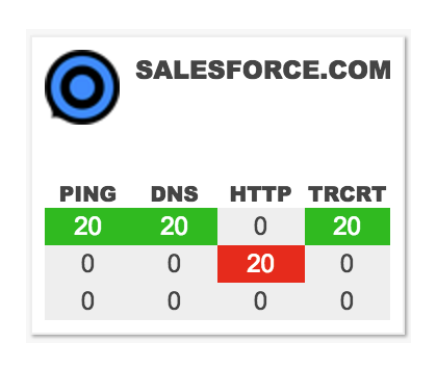
For example, when an outage or performance degradation occurs, the network administrator can quickly review the aggregated real-time information received from all the sensors deployed and determine if the failure is local to one site, common to a subgroup of sites, or global to all sites in the network. In the case where all the sensors are reporting the same failure with a DNS or an HTTP service, this is oftentimes the proof that the root cause is not the network, but rather the service itself. If, on the other hand, only one agent, or a group of agents, triggers an alert, then the network administrator can safely isolate the root cause in the network layer.

In today’s enterprises, network monitoring sensors are becoming so vital that we could compare them to thermostats. In fact, the same way that a thermostat gives you information about a room’s temperature, a network sensor provides measurements of network performance at a remote site.

Conclusion
If you want to test NetBeez’ implementation of active monitoring, you can do it now by requesting a free trial. Included in the NetBeez free tier:
- The management dashboard: this is the graphical user interface that you will use to manage the sensors, create monitoring targets, and review real-time and historical data;
- License for three hardware and two virtual sensors: you can receive up to three hardware appliances (Ethernet and/or WiFi), and deploy the virtual license on VMware, Docker, or Linux.
Once you are set up, all you have to do is create targets to internal or external websites that your users access. Happy monitoring with NetBeez!


