One month ago, the Interop tradeshow was about to start. The NOC team was finalizing the InteropNet network infrastructure that was configured during hot stage, and the NetBeez team was making sure that proper coverage was set for the wired and wireless network.
The days of the Interop tradeshow went well because no service downtime or outages occurred. The InteropNet network was able to deliver good performance for the 300 Interop exhibitors and 10,000+ attendees.
But how was the network experience?
Let’s review the data collected by the BEEZ during the two and a half days of the service. However, before doing so, I would like to review how the network was configured and built so you have all the information you need to interpret the data that I will share.
InteropNet network design and configuration
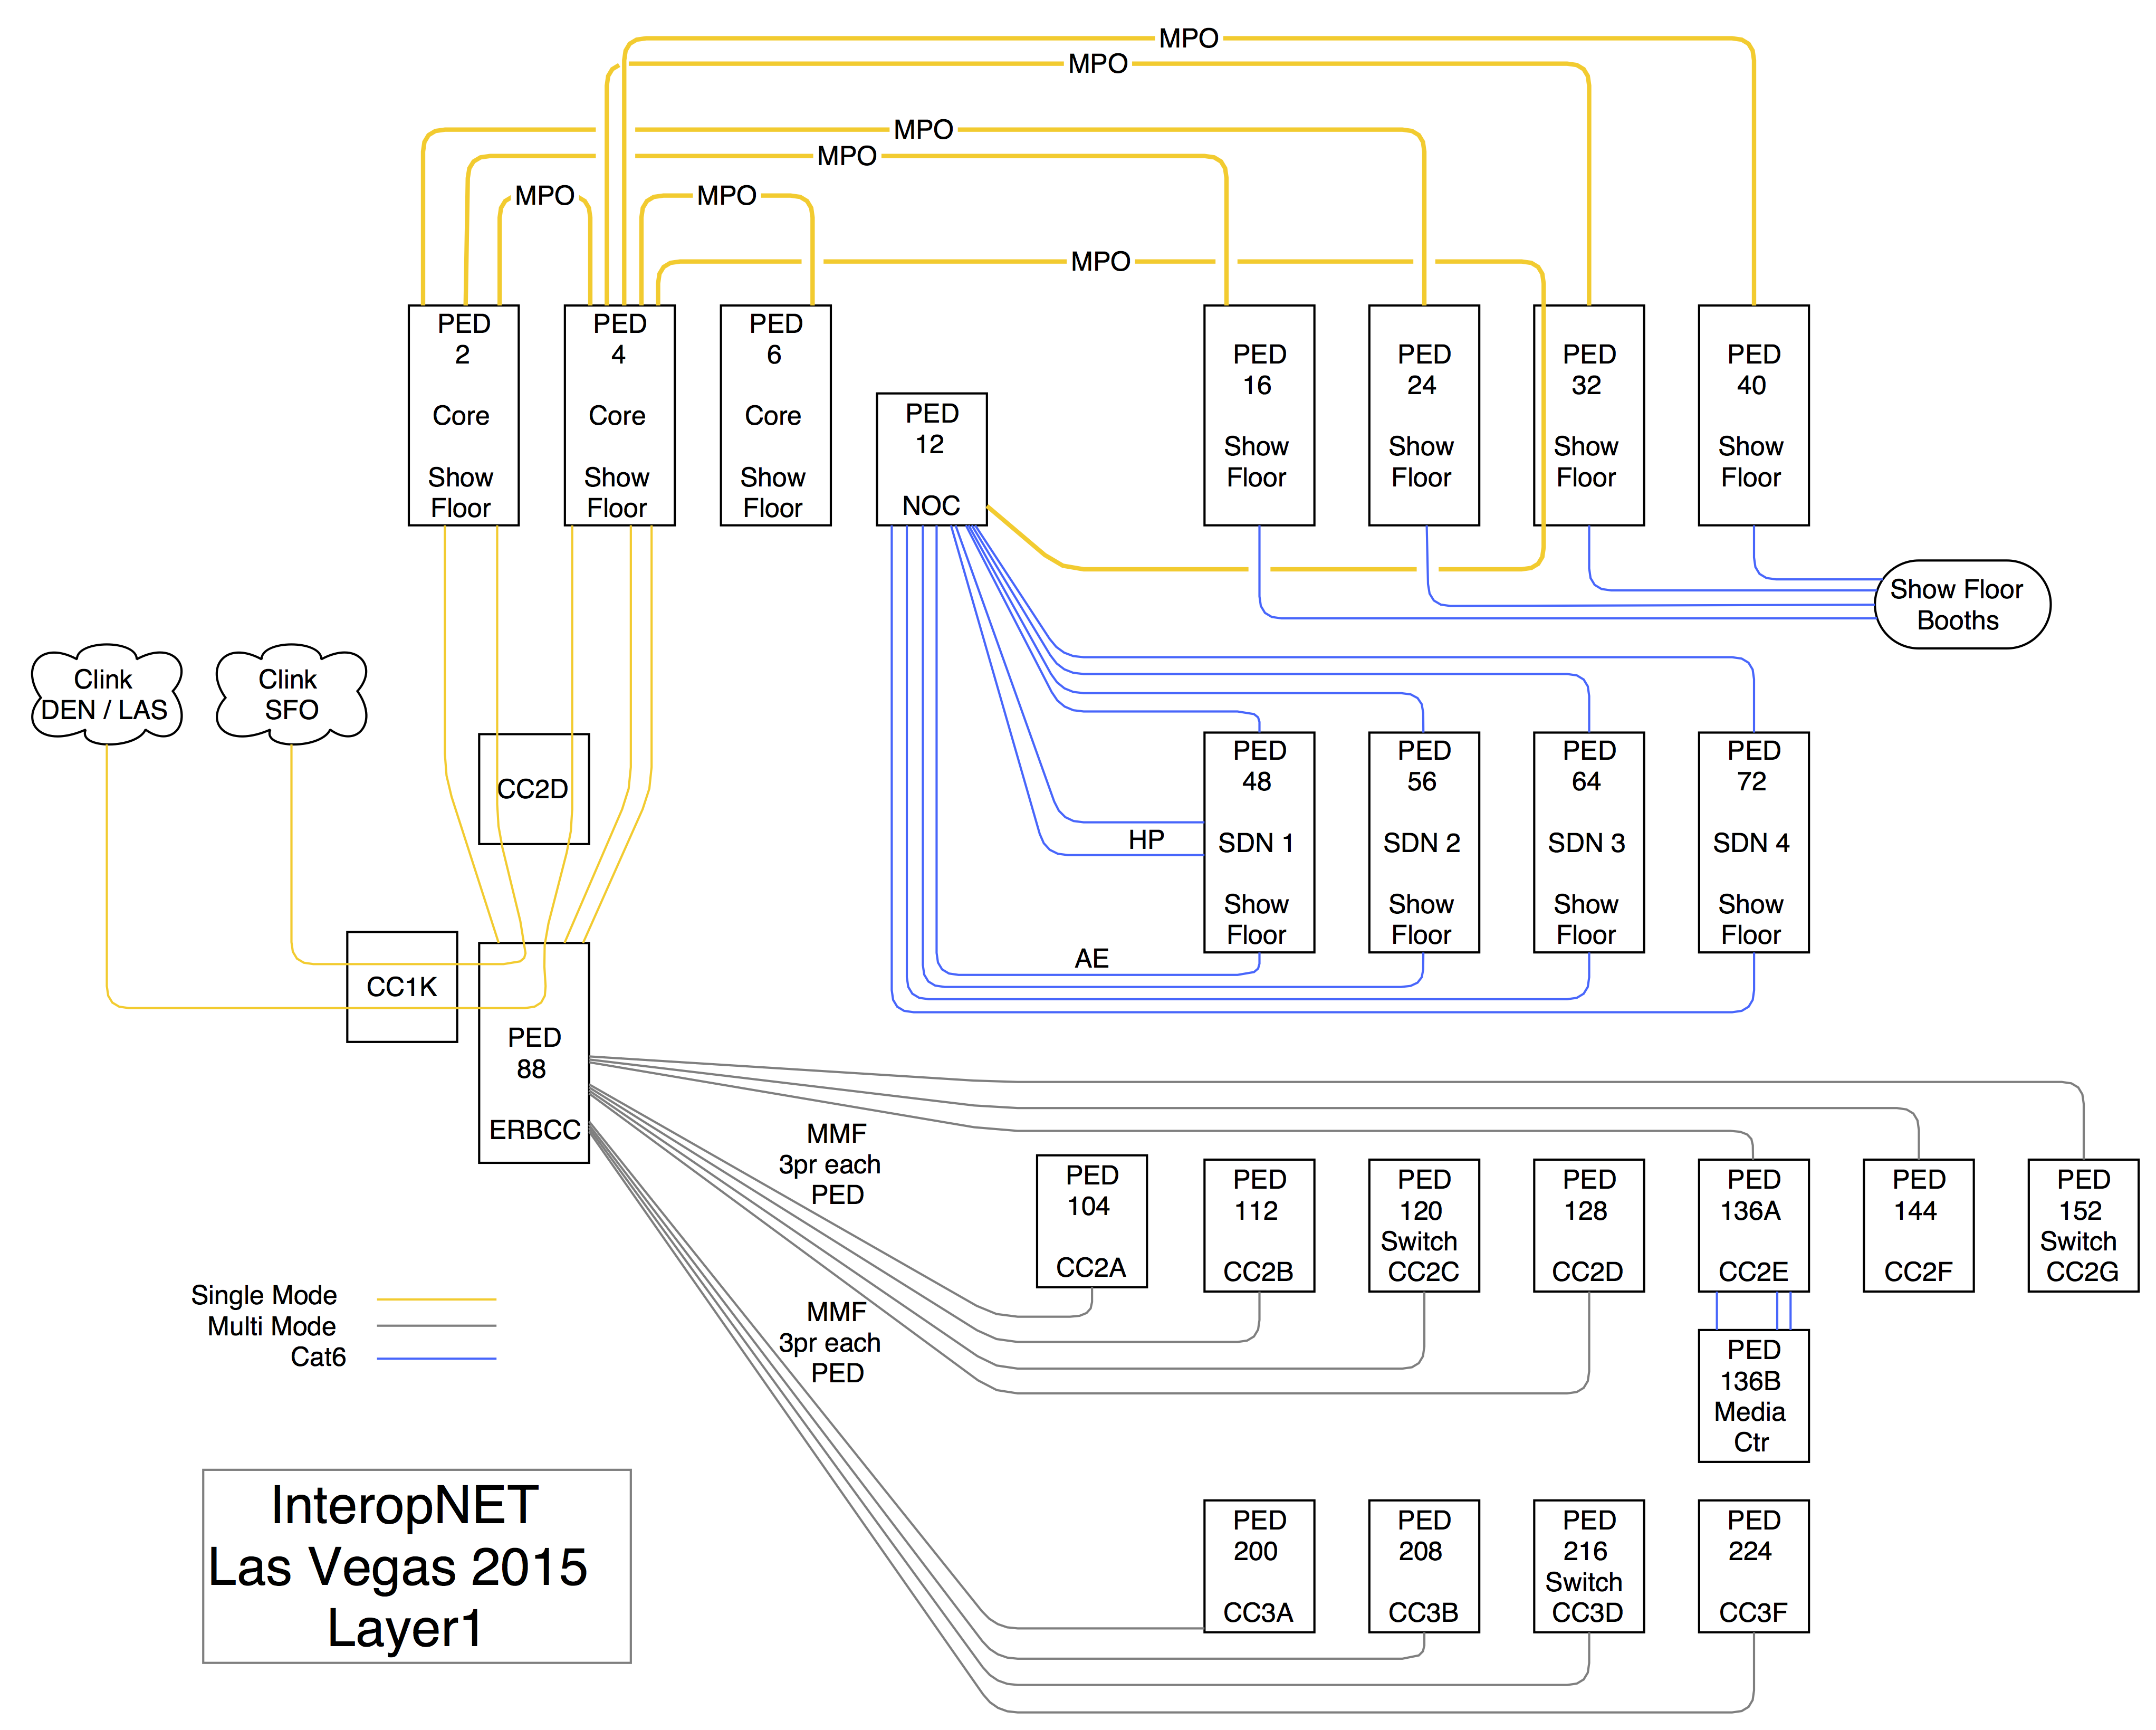
The network infrastructure, called InteropNet, deployed at the Mandalay Bay convention center, consisted of:
- Three core PEDs (racks) that hosted:
- Edge routers: Cisco ASR 1002
- Core routers: Cisco Catalyst 6505-E
- DNS appliances: Infoblox 4030
- Wireless controllers: Ruckus Zone Director 3000
- Four show floor PEDs that hosted the wired access for the exhibitors (Cisco Catalyst 3750E), the wireless access points for the exhibitors and attendees (Ruckus AP), and the DHCP servers (Infoblox Triznic 1400)
- One PED at the NOC that would act as wired access (Cisco Catalyst 3750E) as well as distribution point for the 4 PEDs used for the SDN Lab
- Four PEDs for the SDN Lab with various vendors and equipment
- Twelve PEDs for the off show floor network that serviced the Ruckus access points as well as wired connections for the UBM staff (registration, media center, speaker services, ..)
All racks and network equipment were interconnected with single-mode fiber and/or CAT-6 copper connections. You can review the cabling diagram that was used as layout below:
NetBeez deployment
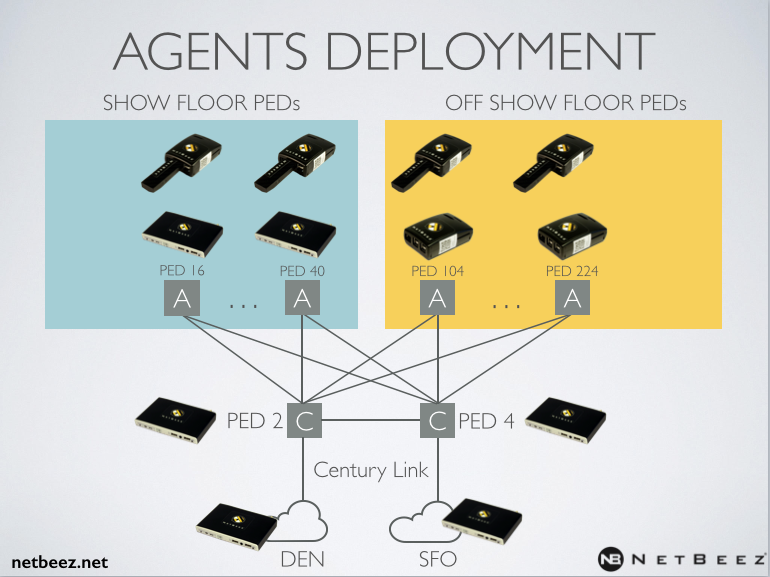
Based on this configuration, NetBeez deployed a total of 42 agents:
- One external agent on google cloud to verify whether a specific performance issue with an application was limited to the InteropNet network or not
- Six GigEthernet agents on core locations of the network
- 23 FastEthernet agents on access locations of the network
- Twelve Wireless agents on the show floor area as well as off show floor area
The following diagram provides a better overview of the deployment made at InteropNet:
From a monitoring configuration perspective, we pushed different types of targets to verify that exhibitors and attendees had network connectivity and good performance.
| NetworkPerformance |
|
| Application Performance |
|
| Wireless Performance |
|
Performance measurements
The data that I will report in the next section are averages of the tests and measurements collected during the tradeshow, between Tuesday, April 27th and Thursday, April 30th.
The colo targets
The network had two uplinks to the outside world offered by CenturyLink. The primary one went to the San Francisco (Sunnyvale) data center, while the secondary one went to the data center in Denver, Colorado. The purpose of this target was to measure network performance to both upstream data centers.
Primary path to SFO data center
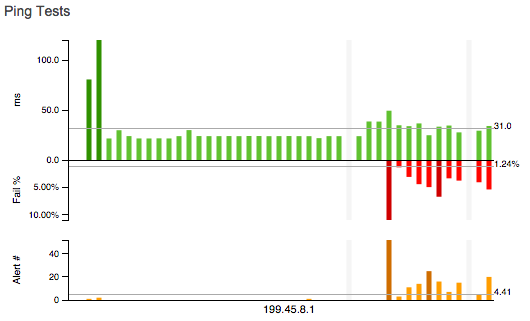
Hop count from show floor PEDs: 3
Hop count from off show floor PEDs: 4
Average RTT: 31 ms.
Average loss: 1.24%
Primary path to DEN data center
Hop count from show floor PEDs: 4
Hop count from off show floor PEDs: 5
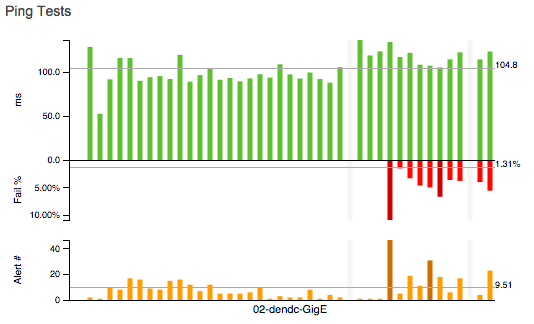
Average RTT: 104 ms.
Average loss: 1.31%
In both targets, I decided not to report the actual data associated with the histograms, which represent the individual agent’s performance. However, that data is available in the Reports section of the NetBeez dashboard.
As you can see, the agents on the right hand side of both graphs have higher packet loss than the rest of the group. The reason for such high packet loss is because those are wireless agents, so that’s acceptable and in line with what we measured in other network environments.
Full-Mesh PING target
This target was configured to verify network latency and packet loss from any access switch to any other access switch within the network. For this reason, we pushed a full-mesh of PING tests to all the wired agents (FastE and GigE). The results of this test are summarized in the following tables:
Measurements for the show floor PEDs:
| PED | 2 | 6 | 12 | 16 | 24 | 32 | 40 | 72 | 88 |
| RTT (ms.) | 8.0 | 13.7 | 8.4 | 7.5 | 8.2 | 8.3 | 8.2 | 8.3 | 13.6 |
| Packet Loss (%) | 0.04 | 0.03 | 0.21 | 0.25 | 0.25 | 0.26 | 0.25 | 0.24 | 0.03 |
Measurements for the off show floor PEDs:
| PED | 112 | 128 | 136a | 136b | 144 | 152 | 200 | 208 | 224 |
| RTT (ms.) | 8.2 | 8.7 | 8.1 | 8.5 | 9.0 | 9.1 | 9.0 | 9.1 | 8.9 |
| Packet Loss (%) | 0.49 | 0.49 | 0.49 | 0.58 | 0.49 | 0.49 | 0.57 | 0.79 | 0.77 |
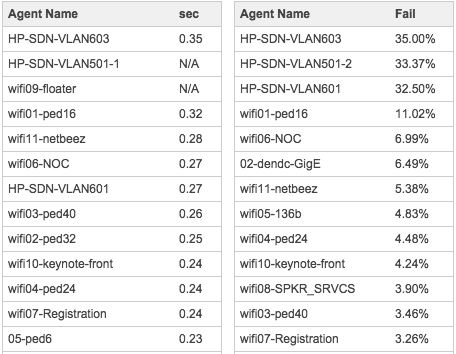
Performance measurements to Google and Interop websites
We also created two targets to web servers: the google.com seach engine and the interop.com website. For both targets, we had good measurements – the average time to GET the page for www.google.com was 0.3 seconds, and 0.2 seconds for www.interop.com.
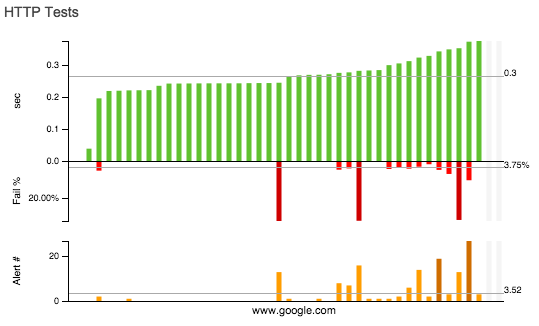
Here is the table associated with the histograms plotted in the chart above:
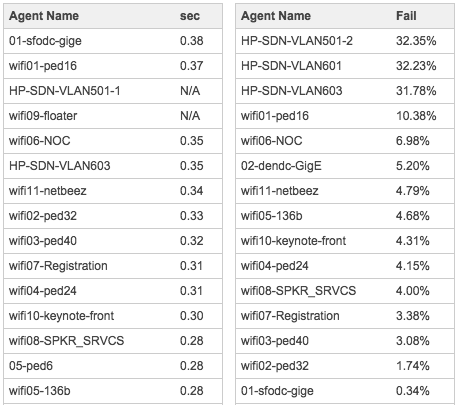
While for the Interop website, we got:
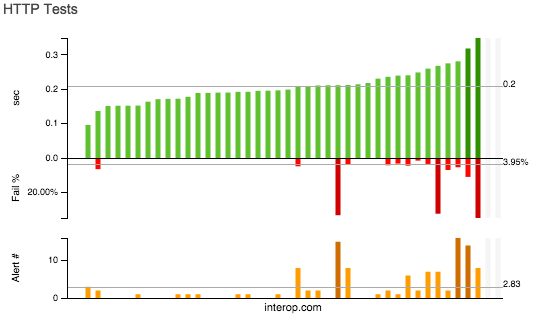
Below is the table associated with the histograms plotted in the chart above:
DNS performance
Robert Nagy and Josh Kuo at Deep Dive (deepdivenetworking.com) worked with Infoblox to provide IPAM services (DNS and DHCP) at InteropNet. Let’s see what our friends at Deep Dive were able to provide during the show in terms of DNS performance. As test benchmark, we configured DNS A queries to www.google.com. Below are the results of the DNS tests that we ran against the primary and secondary DNS servers (Infoblox 4030):
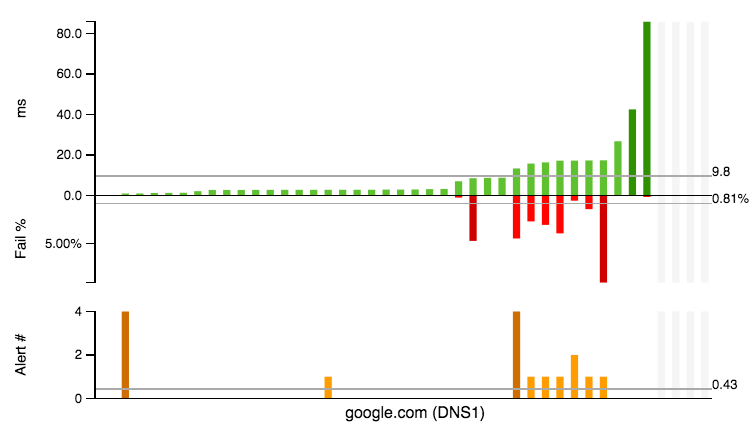
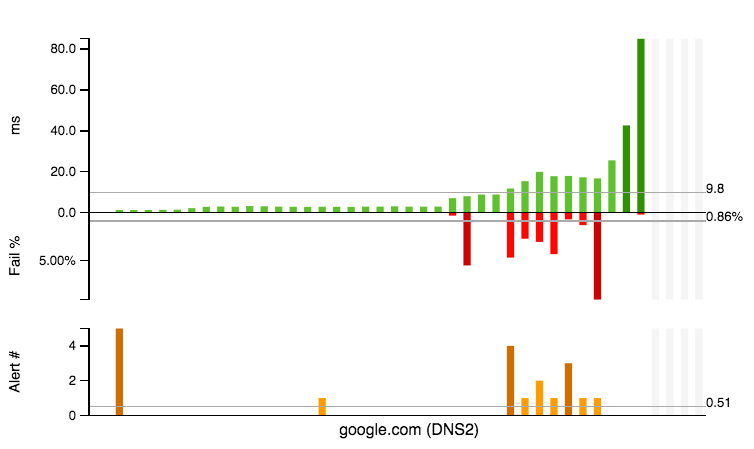
The average RTT to the primary and secondary DNS server was 13 ms. The DNS query time time for both the primary and secondary server was 9.8 ms.
Conclusion
I hope this article was beneficial in understanding how well the InteropNet network performed during the tradeshow in Las Vegas. User perception of network and application performance is important because, in the end, users are the final “customers” of the services that network engineers provide. However, user perception it is not useful for improving and successfully managing enterprise infrastructure. Engineers need hard data to monitor and improve the services that they provide to their end users.
If you want to read more about what we measured and found out during Interop, I then encourage you to read the article that recently appeared on InformationWeek.
Credits to Glenn Evans, lead architect of InteropNet and founder/CEO of Acrux Consulting, who pointed out that the term PED is a historical reference to what is now equipment rack. Specifically, there are two types of PEDs:
- R-Ped Routing Ped
- C-Ped Concentrator Ped.