We are excited to announce a fully redesigned and rebuilt Reports feature as part of the 1.2 update. This is one of the major features of 1.2 and has been a long time in the making. Historical network and performance data has always been a big part of monitoring and troubleshooting with NetBeez, so we wanted to make it more accessible and easier to work with.
The new Reports feature greatly expands the historical reporting capabilities of NetBeez. Previously, historical reporting was limited to Target-centric reports and output was divided between global and interval average reports. This setup made it difficult to get the full picture of past data, not to mention there was no option for Agent reports.
One of my central goals in redesigning Reports was to improve the interface and the overall process of generating and viewing the reports. The form has been streamlined and the report output has been consolidated – no more choosing between global and interval averages. We’ve also added ways to save and share reports, as well as automate them. So in addition to finding new functionality, you’ll hopefully find Reports nicer to use, too.
So what’s new?
More Report Options, Smoother Experience
With the new release, we bring you four types of reports – network status overview, Agent, Target, and scheduled tests (Iperf, SpeedTest, and VoIP). These reports provide more comprehensive insight into all aspects of your network and resources.
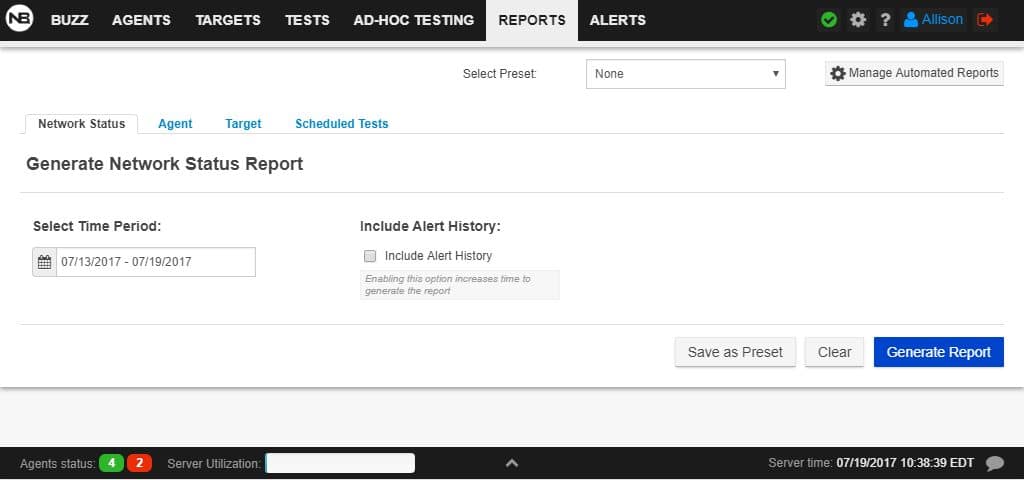
We’ve also improved how you generate, read and manage reports on the dashboard. The redesigned form makes generating reports quick and easy. The new report output format puts all the report’s data in one place, eliminating the need to generate separate reports on the global average and the interval average. Furthermore, you are now able to have multiple reports up at the same time, making comparison and analysis easier than ever before.
New and Improved Visualizations and Filtering
New visualizations provide a more complete and cohesive view of the report’s information. In addition to revamped versions of the original visualizations, we’ve added some new alert-based visualizations. Even better, you are now able to filter the report’s data from a single panel, giving fine-grained control and drilling down using historical data. These new filtering controls apply to all visualizations in the report, so no more deselecting the same agent over and over from multiple graphs.
Export your Reports as PDFs
Want to save or share that report you just generated on the dashboard? You can now download your reports as PDFs. This feature makes it easy to share historical network performance data with colleagues and other stakeholders, especially those who may not have access to the NetBeez dashboard.
Automated Reports
Now you can automate the whole reporting process. Configure your reports and have them sent to you and other recipients via email on a regular schedule. You’ll be able to get detailed reports without having to generate them on the dashboard every time.
What’s Next?
We’re not finished with Reports quite yet – there’s more in store for future releases. One major addition we’re looking forward to is adding a wireless report, so if that piques your interest, stay tuned.