NetBeez Version 11.0
This week the development team is releasing version 11.0 of NetBeez (v11 release notes). This version comes with three important improvements aimed at revamping the overall NetBeez dashboard experience. They are:
- A new onboarding sequence that simplifies the configuration and deployment of new installations
- A new visualization to display and analyze real-time and historical test data
- A new login screen
Users of both on-premises and hosted dashboards will have the option to apply the new version within 30 days from the release date. In the following paragraphs I want to talk a bit more about the importance of these updates and also cover what to expect in successive releases.
New Onboarding Experience
The new onboarding experience will enable first time users to easily configure, in a few steps, the key resources that are required to successfully activate a new NetBeez installation.
Before this release, the onboarding only consisted in the creation of the admin user and upload of the license. In the new procedure the user can select to monitor predefined targets. For example SaaS applications like Microsoft Teams or Salesforce. It will also include a step to create custom targets to monitor websites or network performance tests for VPN or default gateway’s performance. The predefined targets is a significant improvement whereas before the user had to manually specify the destination IP or URL and pick the right tests. It will also improve the future reporting functionalities. In release 12.0 we will be introducing a new set of reports.
SaaS Targets
In the following screenshots the user selected three applications to monitor: Google Calendar, Google Workspace, and MS Outlook. As a result, the dashboard will create three targets with appropriate network monitoring tests included to verify latency, packet loss, DNS resolution, and HTTPS response time to those specific applications.

Target Templates
In the following screenshot, you can see the onboarding step where the user has added one target to monitor the gateway performance, one for the VPN, and one for the DNS servers.
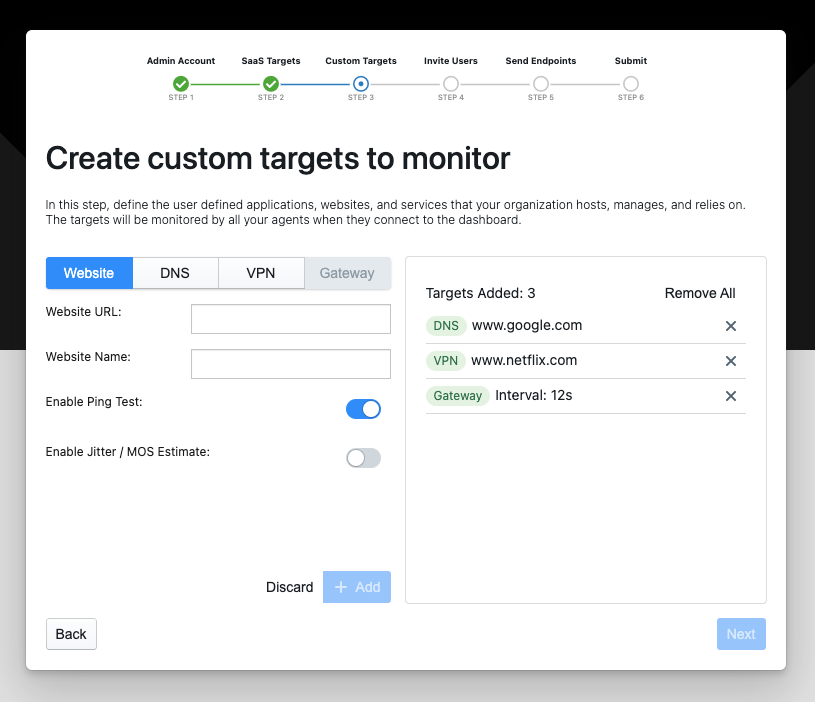
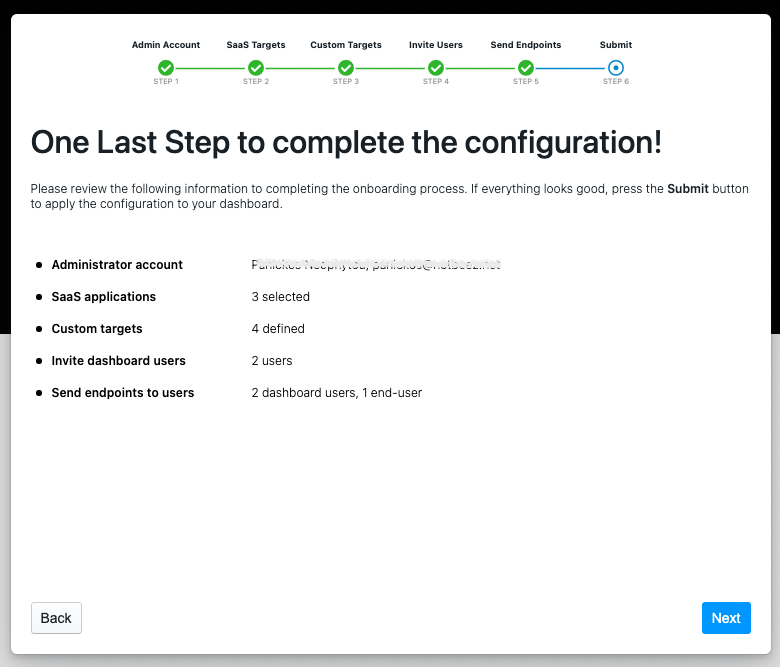
After the custom targets step, the user will be able to invite other coworkers to the dashboard, and then send an email to the end-users that includes the download links for the remote worker agent’s Windows and Mac OS clients. What I like about this new experience is that it further simplifies the initial configuration and deployment because the administrator doesn’t have to figure out where all these settings are located. At the end of the onboarding process, a summary page verifies that all information collected is correct, before creating the actual resources and sending the activation emails.
Although the onboarding only concerns new installations and is a one time process, in future releases (11.1 or 11.2) we are planning to include many of its improvements in dashboards already configured. For example, the use of predefined SaaS and custom targets will be included in the create target workflow. Lastly, it’s also worth mentioning that the initial list of SaaS targets will be updated and expanded in successive releases.
Updated the Real-Time and Historical Tests Visualization
One of the most important functionalities of NetBeez is the ability to review real-time and historical data to understand network performance and find root-causes of end-user experience issues. In version 11 we have merged the real-time and historical test graphs into the same widget to further improve the troubleshooting process. The goal is to easily navigate a large set of data with ease.
As you can see in the following screenshot, when the user clicks on a monitoring test, the visualization will report the real-time test data with the ability to overlap other metrics, such as jitter, MOS as well as endpoint resources utilization. In the following screenshot, latency measurements are overlapped to CPU utilization of the agent.

By clicking on the historical button located at the bottom right portion of the widget, the user can easily expand the time window of the plotted data (see below screenshot). The main chart can be selected with the mouse, enabling a second chart at the bottom that displays the selected time period.

The New Login Screen
In version 11, returning users will be welcomed by a redesigned login window. There’s more than just a new look and feel. The backend associated with the login process was updated as well to facilitate the integration with a long list of third-party single-sign ons that we are including in the coming releases. At the moment, NetBeez integrates with authentication methods such as Azure AD and simple LDAP. In the future, we are looking to expand and include SAML, Okta, One Login, and more.

Conclusion
Version 11 is a step forward in the direction of our product vision that aims at offering a simple to use platform that addresses the network challenges of a distributed and remote workforce.