NetBeez v1.3 Release
The new release of NetBeez brings numerous new features and improvements to the dashboard user interface. We are excited to introduce all-new Incidents, new and improved Buzz Tab, as well as a new display and filtering capabilities for Agents and Targets. We hope that these new features will make your network monitoring more streamlined than ever.
In this post, I will go over these new dashboard features and discuss how you can use them to enhance your network monitoring experience.
The Buzz Tab
In version 1.3, we’ve rebuilt our Buzz Tab from the ground up. While the previous iteration of the Buzz Tab emphasized active alerts on individual tests, the new iteration provides a much more comprehensive high-level view of the current state of your network and resources.
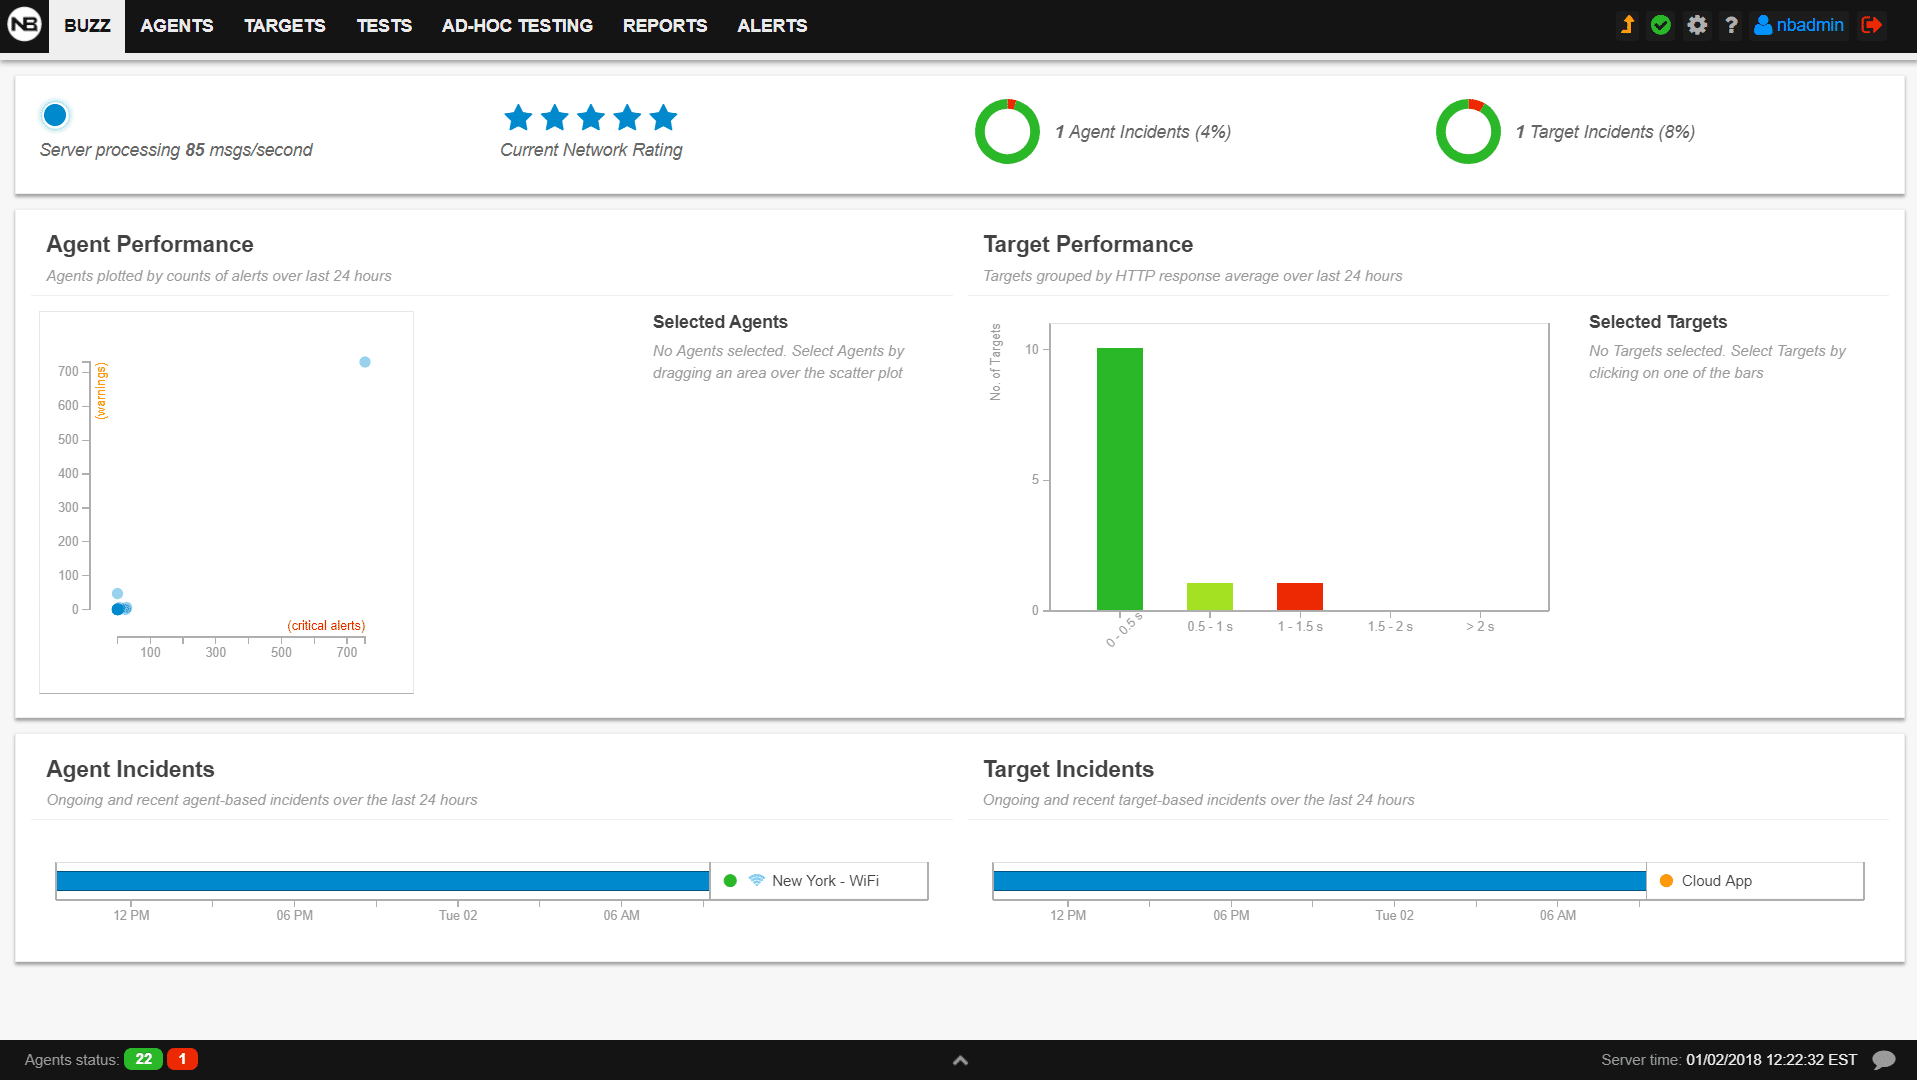 The new Buzz Tab provides a summary of network’s health, the current condition of both Agents and Targets, and ongoing and recent Incidents.
The Buzz Tab header displays the Netbeez server activity, the current network rating based on an aggregation of performance and connectivity metrics, and the current share of Agents and Targets with ongoing Incidents.
The next section maps Agents and Targets based on alert count and distribution of HTTP response time, respectively. These interactive visualizations help you detect patterns in performance issues and zero in on problem areas. Use them to select Agents or Targets you would like to investigate further.
Moving on down, we get to Incidents. Incidents are a major new feature on the dashboard (more on them in a bit). This view provides up to date information on ongoing and recent Incidents affecting Agents and Targets. Click on an Incident (represented in blue) to see more information about it.
All in all, we think that you’ll be able to get a lot more utility out of the new Buzz Tab.
Incidents
The Incident Tab is perhaps the most significant addition to the dashboard user interface. This new feature provides a new, high-level metric for better understanding the health of your network and the important resources you monitor. Previously, this aspect of monitoring was somewhat covered by alerts, but the thing about alerts is that they are low-level, which makes them more difficult to use to detect and evaluate larger and more extensive issues. Instead, Incidents are defined by alerts, which gives you better insight about broader patterns of performance and connectivity, and reduces the noise generated by frequent alert notifications, many of which might repeatedly report the same issue.
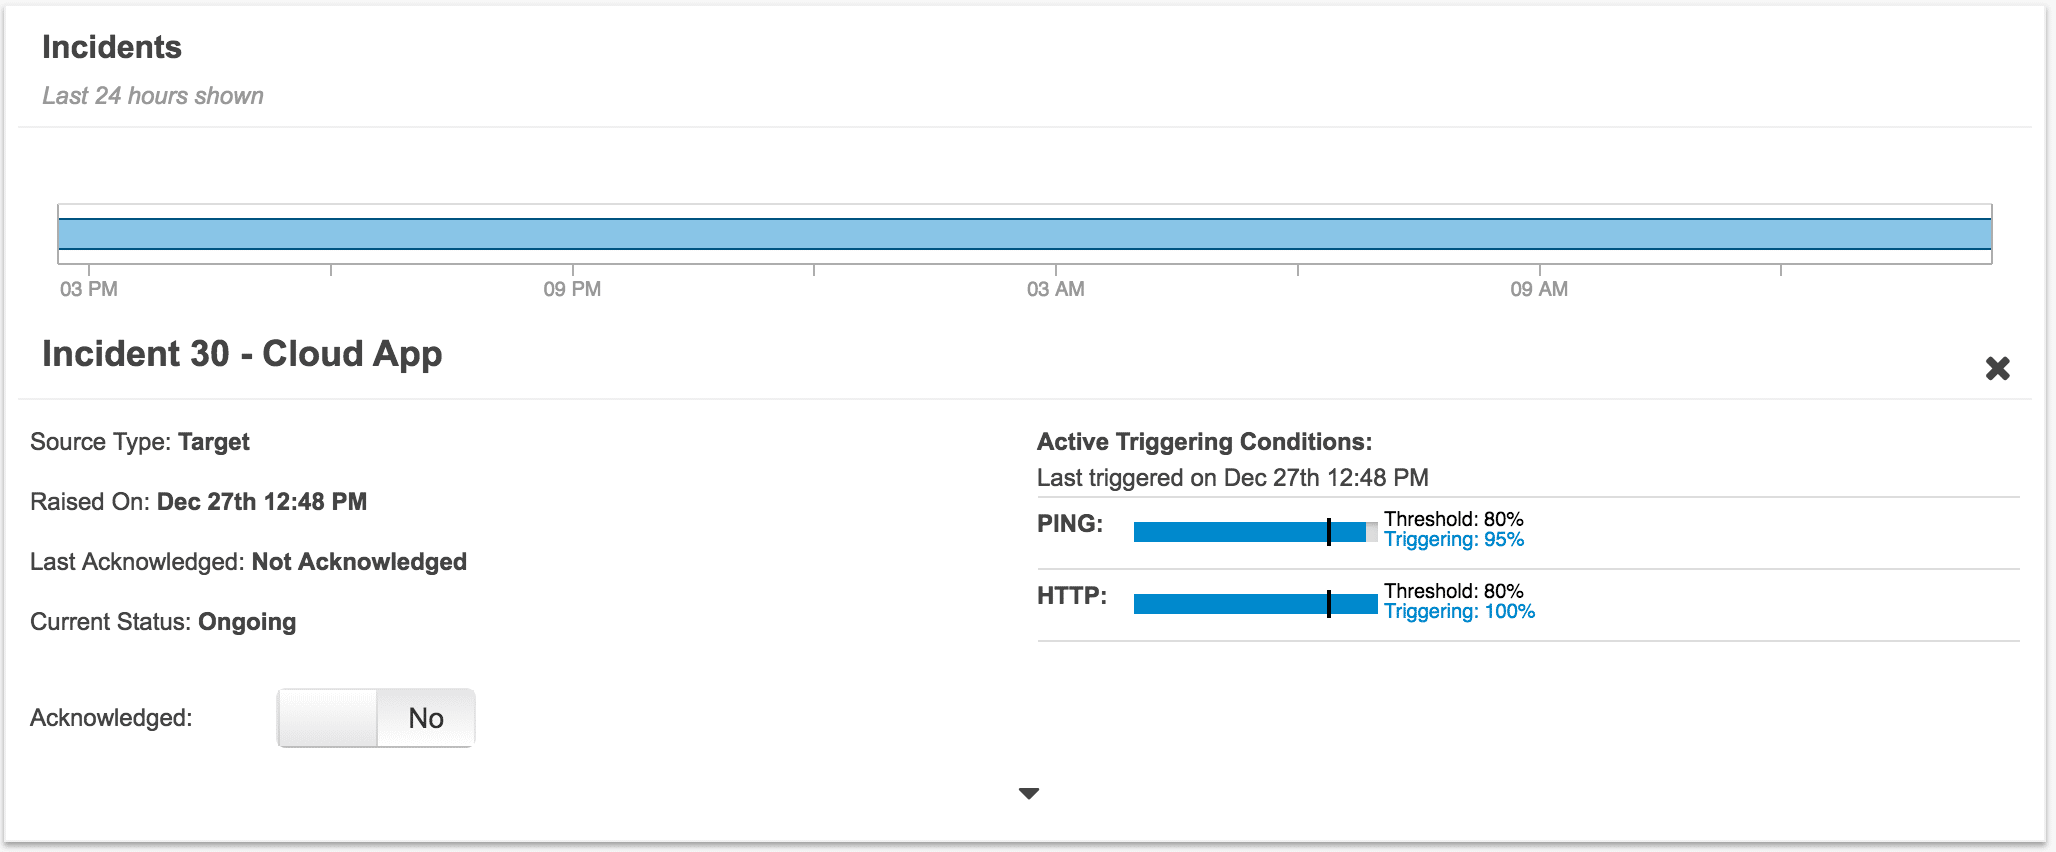 The detail view of an Agent-based Incident showing start time, current triggering condition (traceroute alerts, in this case), and other information.
New View and Filtering for Agents and Targets
Another major UI improvement is the addition of a new list-style view for Agents and Targets, as well as filtering options, which are available for both the new view and the original thumbnail view. On the new list-style view, you can also sort by various attributes. If you’re running a giant NetBeez installation, you’ll probably find that the new filtering options will help you find the Agents and Targets you’re looking for more quickly and easily than ever.
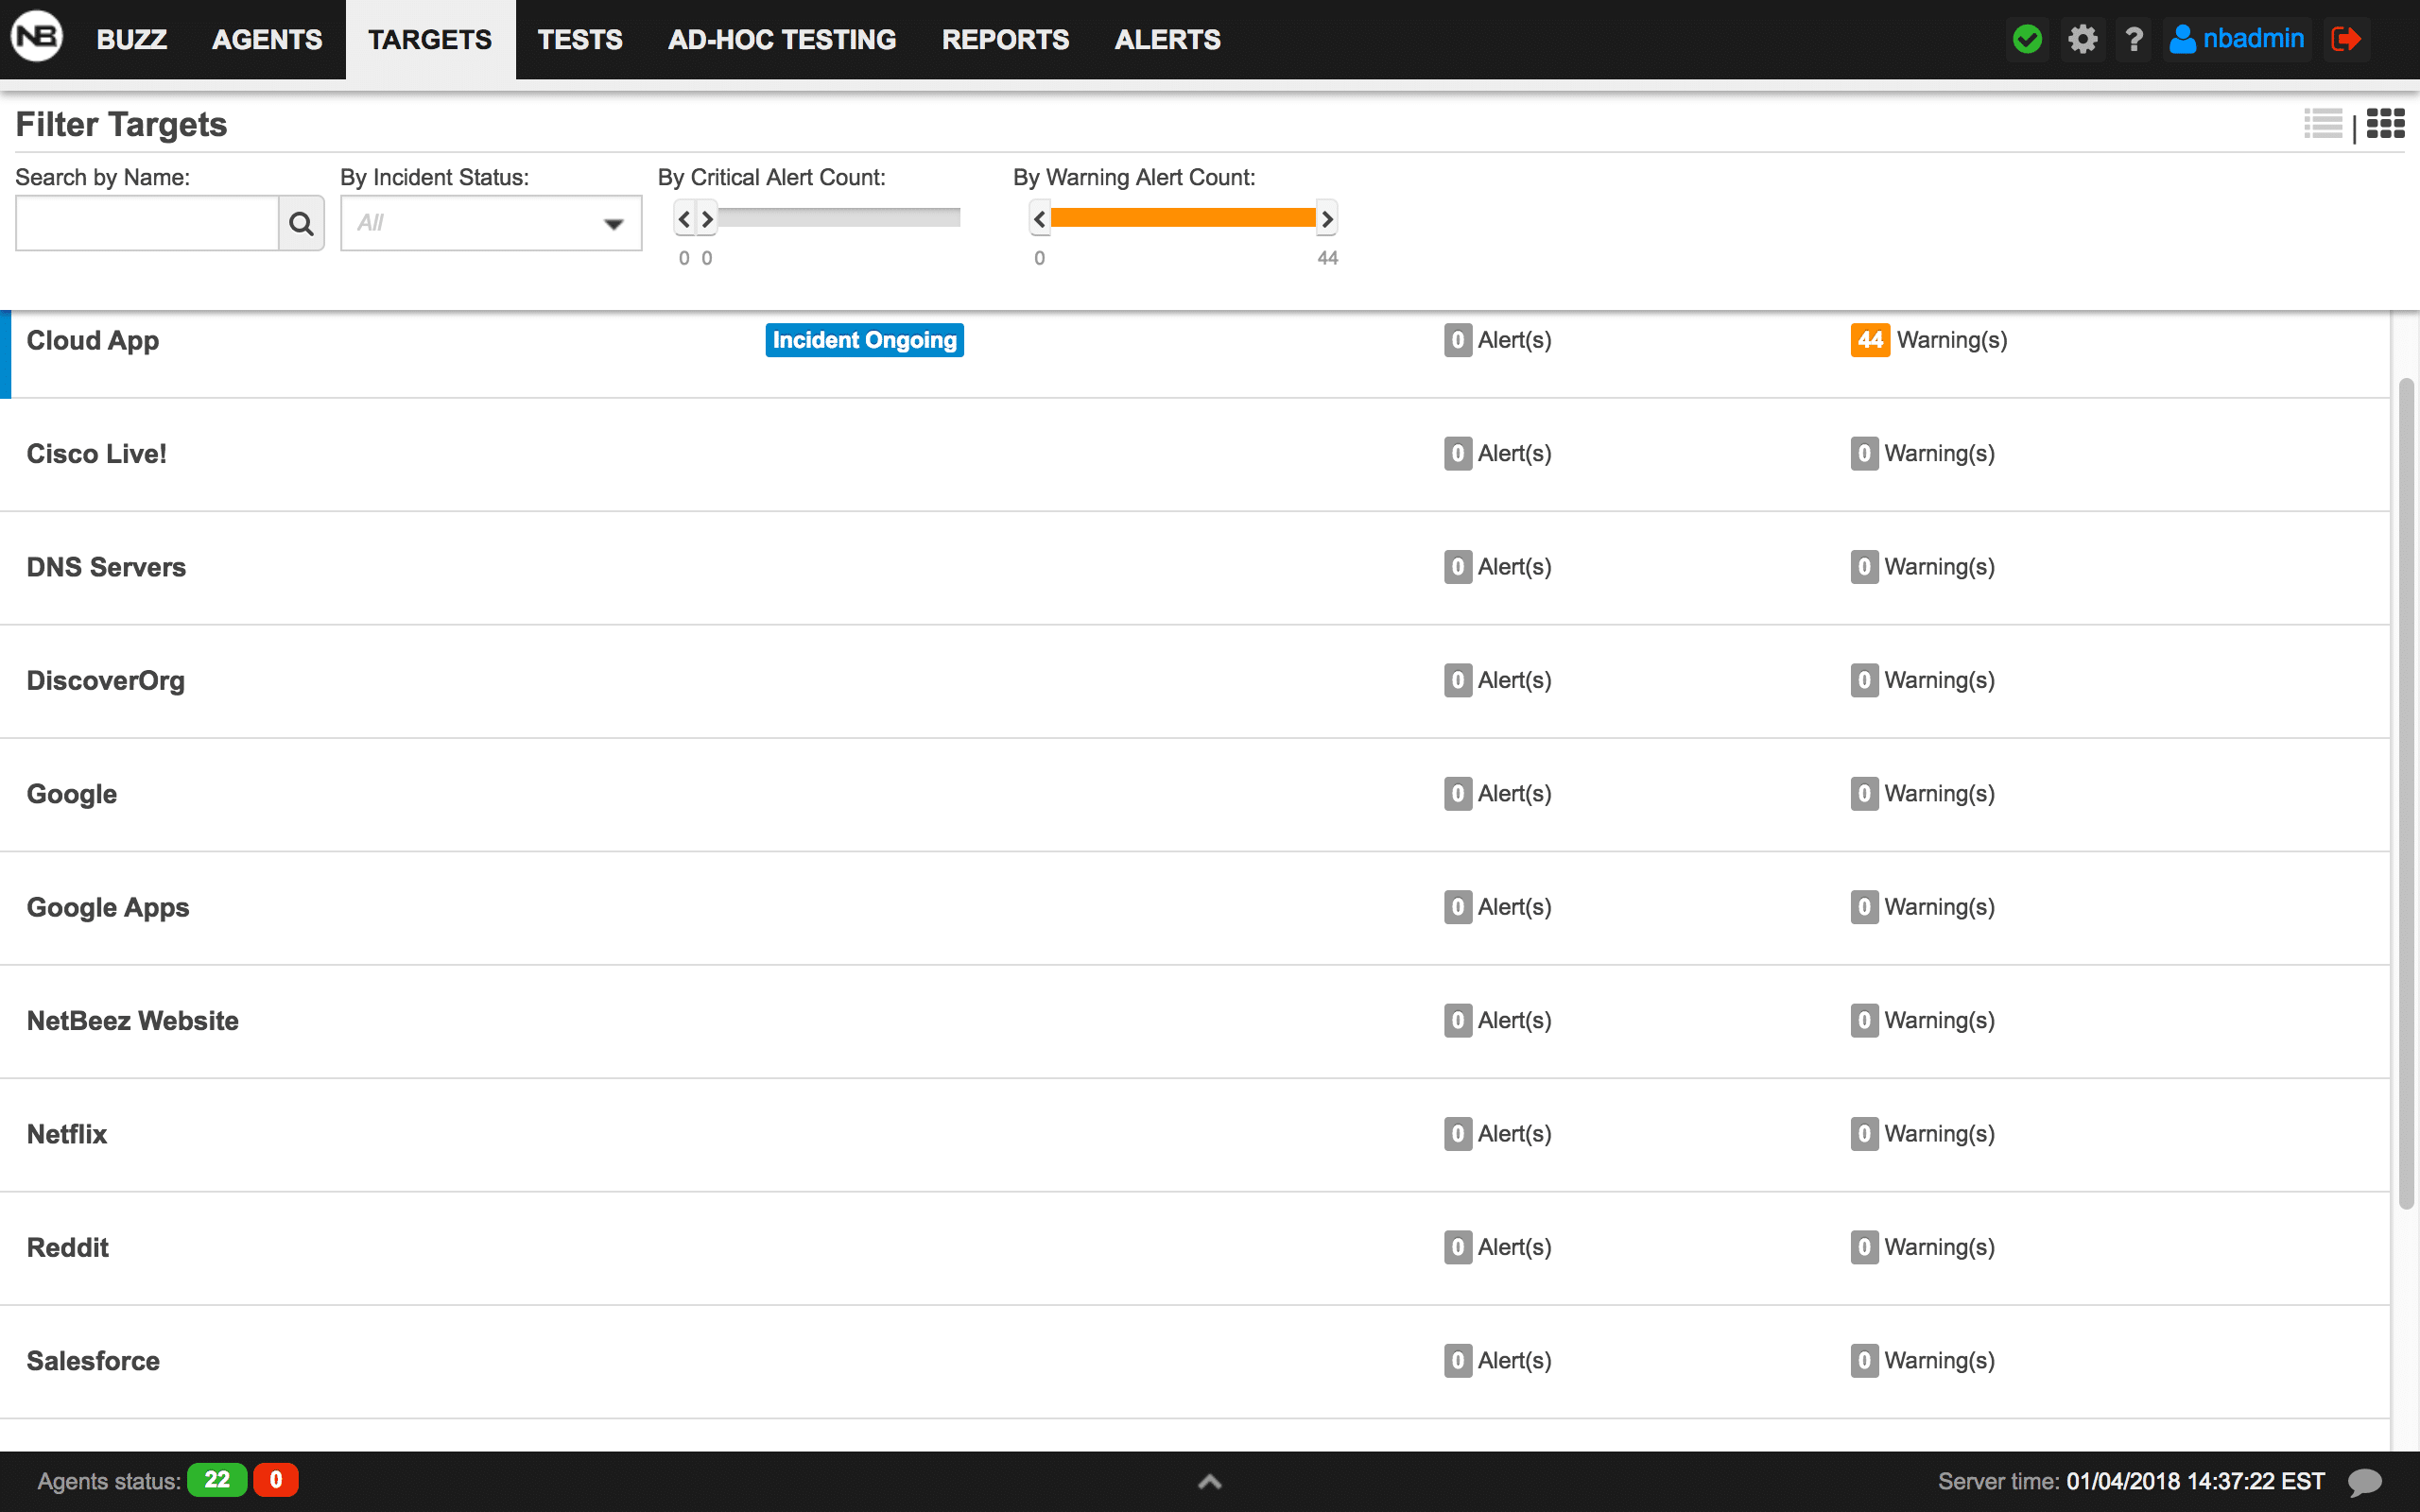 The new list-style view, showing Agents. The list responds instantly to any filters that you apply.
More Improvements
In addition to the major new features above, we’ve made several additional small improvements to the dashboard to make your monitoring experience better. These include:
- HTTP proxy settings
- Iperf3
- Additional controls for managing email recipients for notifications