Service Level Agreements Matter
What differentiates good Internet Service Providers (ISP) from bad ones? Whether or not they meet their Service Level Agreements – SLA. Put simply, an SLA is a contract between a service provider and a subscriber. This contract defines in clear terms the level of performance that the service provider must deliver. An ISP that doesn’t respect their SLA will deal with angry customers, have subscribers switch to other competitors, or, worse, deal with lawsuits.
A survey performed by the US Federal Communication Commission highlighted that one out of three Internet users switched broadband provider because they were looking for better price or performance. This number was high enough to draw the attention of ISP executives, who expect the network engineering team to implement SLA monitoring. As result, network engineers are always looking for reliable ways to verify and ensure proper SLA.
SLA Monitoring Tests
If you work for an ISP, you already know that the best way to enforce SLA is to periodically run network performance tests. The monitoring tests verify that parameters such as network latency and speed. This may sound like an easy task, but it generally isn’t, because the main problem is that for SLA tests to be accurate, they need to be run in production, in similar conditions as the customers’. And this poses many challenges.
ISP networks are large and complex. They are large because they serve a large number of customers. They are complex because are extremely diverse, with different types of underlying connections and third-party carriers that enable the ISP to extend its reach to locations where it doesn’t have network infrastructure. On top of that, their networks are geographically distributed, oftentimes covering multiple US states.
The best way to cover all the bases is to deploy network sensors in sample locations. The deployment of each network sensor should reflect the performance of all users in that area. The best way to do so is to make sure that the SLA tests that the monitoring sensors run cover the same network infrastructure components that users in that area use. This way, the ISP can detect outages or performance issues caused by the network infrastructure itself.
Network Metrics to Include in SLA Monitoring
Once the deployment dilemma has been solved, the network engineer has to set up monitoring tests on the sensors. Here is a list of most common SLA tests that are generally configured.
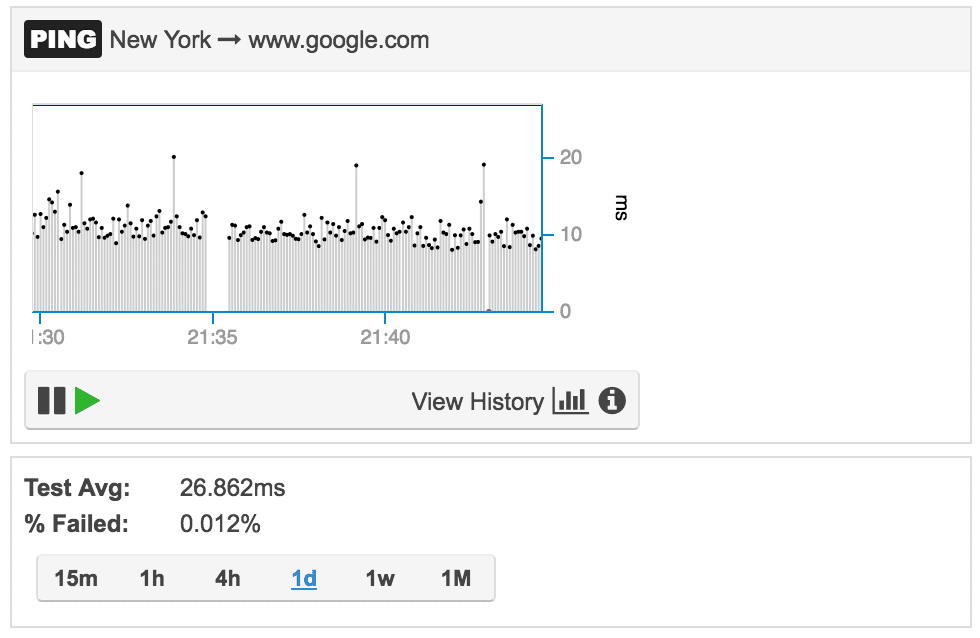
Network latency
Network latency is the time that it takes for a packet to traverse a network segment. To measure this metric, you can use an open source test like OWAMP (one-way ping) or the command line utility ping. Important to remember is that the regular ping test reports the round-trip time to a network destination. That is, to derive network latency you have to divide the round-trip time by two. This assumes that the network is symmetric in terms of latency.
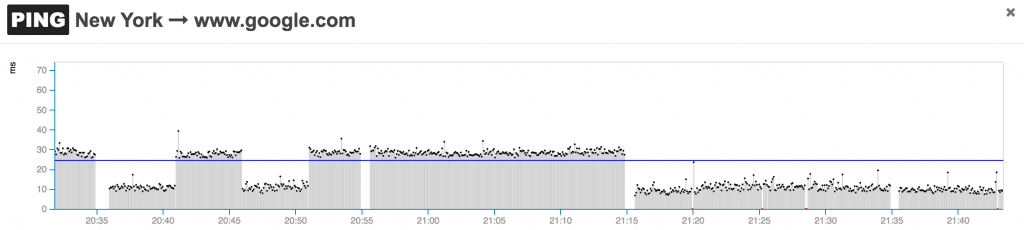
Moreover, some networks deprioritize ICMP traffic via a quality of service (QoS) configuration that assigns that traffic a scavenger type of service. If that’s the case for a network, the latency test can be run with a TCP-based command line utility like hping3. If TCP is selected as measurement method, the round-trip-time should not be calculated with the SYN SYN-ACK transaction time, as some firewalls may interject and inspect the packets, introducing further delays in the measurements, which are not caused by the network itself. For real-time applications to function properly, network round-trip-time should be less than 150 ms. Also, when monitoring RTT, its lowest value should be used as benchmark.
Packet loss
Packet loss is the percentage of packets that are lost in a given period of time. Also in this case, packet loss can be calculated with ping. An alternative way to generate an accurate estimate of packet loss is to generate a UDP stream using the Iperf utility. Packet loss should never be higher than 5%, otherwise applications will start having performance issues.
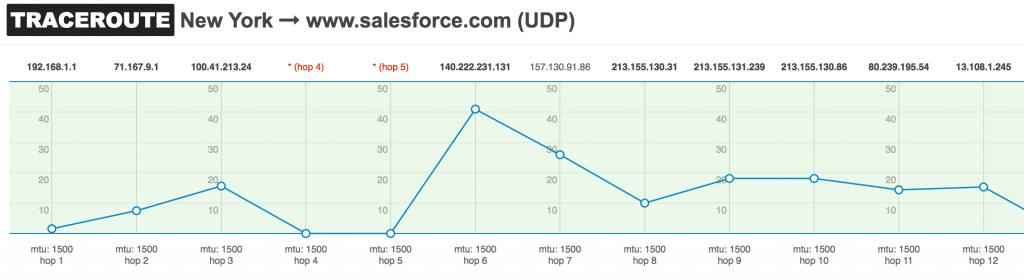
Path MTU
This measurement reports the size of the largest packet that can traverse a network path without being discarded. Generally, 1500 byte packets should be allowed to traverse the network. If that’s not possible, some applications may have performance issues or completely stop working. This value can be calculated with the traceroute utility in Linux. If you want to learn more about troubleshooting MTU issues, I previously covered this topic.
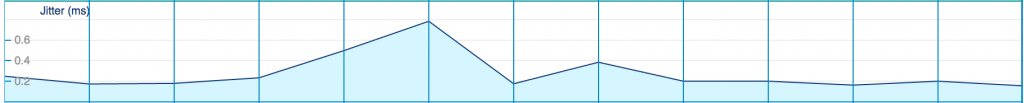
Jitter
Jitter measures the variation in the delay of received packets. High jitter will degrade real-time applications, like voice-over-IP (VoIP) or video streaming. VoIP devices implement jitter buffering algorithms to compensate packets that arrive at high timing variations, and packets can even get dropped when they arrive with excessive delay. A tool like Iperf can provides these measurements. Panos wrote a good article on the impact of jitter on VoIP calls in this blog post.
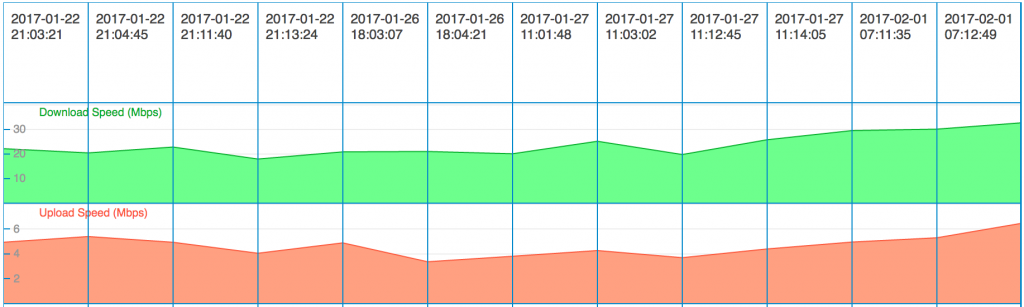
Download and upload speed
The transfer rate, generally expressed in bits per second, represents the amount of data that the network can carry from one host to another. The type of service (ISDN, ADSL, Fiber, etc.) and plan that a subscriber selected define that maximum speed achievable. Internet Service Providers and subscribers can measure download and upload speed by using tools like iperf or speedtest. When measuring download and upload speed make sure that:
- packet loss should is less than 5%
- jitter is less than 150 ms
- the two testing devices are capable of processing equal or higher data rates than the actual speed of the network
This will ensure that the measurement is accurate.
Closing Remarks on SLA Monitoring
Monitoring SLA for is easier said than done. When planning for an network monitoring system and methodology, evaluate what metrics to measure as well as what . I hope that this short post gave some high-level directions on how to proceed and some insight to keep in mind. If you want to explore the topic more deeply, here are three Request For Comments (RFC) that you can review:
- RFC 6349 (https://tools.ietf.org/html/rfc6349) offers a framework for throughput testing
- RFC 2544 (https://tools.ietf.org/html/rfc2544) discusses and defines a number of tests that describe the performance characteristics of an interconnecting network device
- RFC 4821 (https://tools.ietf.org/html/rfc4821) describes a method for Path MTU Discovery